Xcel Energy 2015 Annual Report Download - page 36
Download and view the complete annual report
Please find page 36 of the 2015 Xcel Energy annual report below. You can navigate through the pages in the report by either clicking on the pages listed below, or by using the keyword search tool below to find specific information within the annual report.-
 1
1 -
2
-
3
-
4
-
5
-
6
-
7
-
8
-
9
-
10
-
11
-
12
-
13
-
14
-
15
-
16
-
17
-
18
-
19
-
20
-
21
-
22
-
23
-
24
-
25
-
 26
26 -
 27
27 -
 28
28 -
 29
29 -
 30
30 -
 31
31 -
 32
32 -
 33
33 -
 34
34 -
 35
35 -
 36
36 -
 37
37 -
 38
38 -
 39
39 -
 40
40 -
 41
41 -
 42
42 -
 43
43 -
 44
44 -
 45
45 -
 46
46 -
47
-
48
-
49
-
50
-
51
-
52
-
53
-
54
-
55
-
56
-
57
-
58
-
59
-
60
-
61
-
62
-
63
-
64
-
65
-
66
-
67
-
68
-
69
-
70
-
71
-
72
-
73
-
74
-
75
-
76
-
77
-
78
-
79
-
80
-
81
-
82
-
83
-
84
-
85
-
86
-
87
-
88
-
89
-
90
-
91
-
92
-
93
-
94
-
95
-
96
-
97
-
98
-
99
-
100
-
101
-
102
-
103
-
104
-
105
-
106
-
107
-
108
-
109
-
110
-
111
-
112
-
113
-
114
-
115
-
116
-
117
-
118
-
119
-
120
-
121
-
122
-
123
-
124
-
125
-
126
-
127
-
128
-
129
-
130
-
131
-
132
-
133
-
134
-
135
-
136
-
137
-
138
-
139
-
140
-
141
-
142
-
143
-
144
-
145
-
146
-
147
-
148
-
149
-
150
-
151
-
152
-
153
-
154
-
155
-
156
-
157
-
158
-
159
-
160
-
161
-
162
-
163
-
164
-
165
-
166
-
167
-
168
-
169
-
170
-
171
-
172
-
173
-
174
-
175
-
176
-
177
-
178
-
179
-
180
 |
 |

18
Colorado “Our Energy Future” Plan — In January 2016, PSCo introduced the “Our Energy Future” Plan in Colorado. This proposal
ties together innovative technology, economic development and customer initiatives to give customers more control over their energy
use, prepare for the future energy demands of the state and keep rates competitive. The key components of the plan, which includes
several filings with the CPUC, are as follows:
• Two Innovative Clean Technology pilot programs in partnership with leading companies to address electric battery efficiency
and reliability including demonstrations to test microgrids and battery technologies for integration of distributed resources;
• Alignment of PSCo’s pricing in a more fair and equitable manner for Colorado customers;
• Introduction of Solar*Connect®, a new, cost-based program that will offer customers a choice to sign up for 100 percent
solar power and add an incremental 50 MW of solar generation;
• Investing in natural gas reserves to take advantage of historically low natural gas prices by locking in current costs to provide
long-term stable rates for customers;
• Exploring opportunities for up to 1,000 MW of additional renewable resources to be presented later this year for
consideration by the CPUC; and
• Presenting an intelligent grid proposal later this year focusing on interactive meter technology that will improve customer
choice and control of their energy use.
RES Compliance Plan — Colorado law mandates that at least 20 percent of PSCo’s energy sales are supplied by renewable energy
through 2019, with the percentage increasing to 30 percent by 2020 and includes a distributed generation standard. PSCo is in
compliance with the RES as of Dec. 31, 2015.
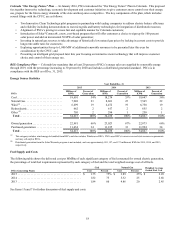
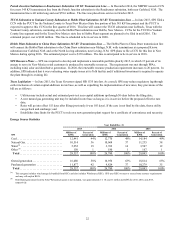
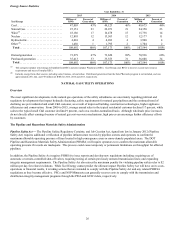
Energy Source Statistics
Year Ended Dec. 31
2015 2014 2013
PSCo Millions of
KWh Percent of
Generation Millions of
KWh Percent of
Generation Millions of
KWh Percent of
Generation
Coal. . . . . . . . . . . . . . . . . . . . . . . . . . . . . . . . 18,601 54% 18,274 53% 19,647 56%
Natural Gas . . . . . . . . . . . . . . . . . . . . . . . . . . 7,948 23 8,601 25 7,565 22
Wind (a) . . . . . . . . . . . . . . . . . . . . . . . . . . . . . 6,699 19 6,472 19 6,750 19
Hydroelectric. . . . . . . . . . . . . . . . . . . . . . . . . 662 2 617 2 655 2
Other (b) . . . . . . . . . . . . . . . . . . . . . . . . . . . . . 705 2 294 1 250 1
Total . . . . . . . . . . . . . . . . . . . . . . . . . . . . . . 34,615 100% 34,258 100% 34,867 100%
Owned generation . . . . . . . . . . . . . . . . . . . . . 22,981 66% 23,023 67% 22,873 66%
Purchased generation . . . . . . . . . . . . . . . . . . 11,634 34 11,235 33 11,994 34
Total . . . . . . . . . . . . . . . . . . . . . . . . . . . . . . 34,615 100% 34,258 100% 34,867 100%
(a) This category includes wind energy de-bundled from RECs and also includes Windsource RECs. PSCo uses RECs to meet or exceed state resource requirements
and may sell surplus RECs.
(b) Distributed generation from the Solar*Rewards program is not included, and was approximately 245, 197, and 172 million net KWh for 2015, 2014, and 2013,
respectively.
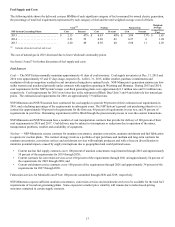
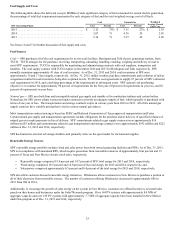
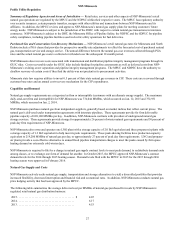
Fuel Supply and Costs
The following table shows the delivered cost per MMBtu of each significant category of fuel consumed for owned electric generation,
the percentage of total fuel requirements represented by each category of fuel and the total weighted average cost of all fuels.
Coal Natural Gas Weighted Average
Owned Fuel Cost
PSCo Generating Plants Cost Percent Cost Percent
2015 . . . . . . . . . . . . . . . . . . . . . . . . . . . . . . . . . . . . . . . . . . . . $ 1.75 75% $ 3.89 25% $ 2.29
2014 . . . . . . . . . . . . . . . . . . . . . . . . . . . . . . . . . . . . . . . . . . . . 1.82 75 5.32 25 2.68
2013 . . . . . . . . . . . . . . . . . . . . . . . . . . . . . . . . . . . . . . . . . . . . 1.84 80 4.86 20 2.45
See Items 1A and 7 for further discussion of fuel supply and costs.