Vtech 2014 Annual Report Download - page 9
Download and view the complete annual report
Please find page 9 of the 2014 Vtech annual report below. You can navigate through the pages in the report by either clicking on the pages listed below, or by using the keyword search tool below to find specific information within the annual report.-
 1
1 -
 2
2 -
 3
3 -
 4
4 -
 5
5 -
 6
6 -
 7
7 -
 8
8 -
 9
9 -
 10
10 -
 11
11 -
 12
12 -
 13
13 -
 14
14 -
 15
15 -
 16
16 -
 17
17 -
 18
18 -
 19
19 -
 20
20 -
21
-
22
-
23
-
24
-
25
-
26
-
27
-
28
-
29
-
30
-
31
-
32
-
33
-
34
-
35
-
36
-
37
-
38
-
39
-
40
-
41
-
42
-
43
-
44
-
45
-
46
-
47
-
48
-
49
-
50
-
51
-
52
-
53
-
54
-
55
-
56
-
57
-
58
-
59
-
60
-
61
-
62
-
63
-
64
-
65
-
66
-
67
-
68
-
69
-
70
-
71
-
72
 |
 |

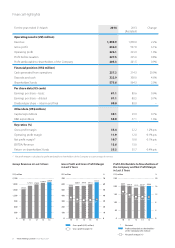
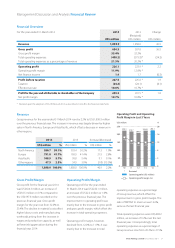
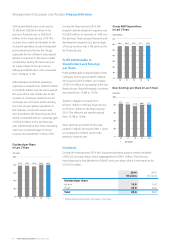
Operating Profit and Operating
Profit Margin in Last 5 Years
Financial Overview
For the year ended 31 March 2014 2014 2013
(Restated)
Change
US$ million US$ million US$ million
Revenue 1,898.9 1,858.0 40.9
Gross profit 634.3 597.8 36.5
Gross profit margin 33.4% 32.2%
Total operating expenses (408.2) (373.9)* (34.3)
Total operating expenses as a percentage of revenue 21.5% 20.2% *
Operating profit 226.1 223.9 * 2.2
Operating profit margin 11.9% 12.0% *
Net finance income 1.4 1.7 (0.3)
Profit before taxation 227.5 225.6 * 1.9
Taxation (24.2) (24.1) (0.1)
Effective tax rate 10.6% 10.7% *
Profit for the year and attributable to shareholders of the Company 203.3 201.5 * 1.8
Net profit margin 10.7% 10.8% *
* Restated upon the adoption of IAS 19 (Revised 2011) as described in note B to the financial statements
Revenue
Group revenue for the year ended 31 March 2014 rose by 2.2% to US$1,898.9 million
over the previous financial year. The increase in revenue was largely driven by higher
sales in North America, Europe and Asia Pacific, which offset a decrease in revenue in
other regions.
2014 2013 Increase/(decrease)
US$ million % US$ million % US$ million %
North America 950.7 50.1% 933.4 50.2% 17.3 1.9%
Europe 791.8 41.7% 769.9 41.4% 21.9 2.8%
Asia Pacific 108.9 5.7% 99.8 5.4% 9.1 9.1%
Other regions 47.5 2.5% 54.9 3.0% (7.4) (13.5%)
1,898.9 100.0% 1,858.0 100.0% 40.9 2.2%
Gross Profit/Margin
Gross profit for the financial year 2014
was US$634.3 million, an increase of
US$36.5 million or 6.1% compared to
the US$597.8 million recorded in the
previous financial year. Gross profit
margin for the year rose from 32.2% to
33.4%. The decline in material costs offset
higher labour costs and manufacturing
overheads arising from the increase in
wages and production capacity, as well
as Renminbi appreciation during the
financial year 2014.
Operating Profit/Margin
Operating profit for the year ended
31 March 2014 was US$226.1 million,
an increase of US$2.2 million or 1.0%
over the previous financial year. The
improvement in operating profit was
mainly due to the increase in gross profit
and gross profit margin, which offset the
increase in total operating expenses.
Operating profit margin, however,
declined from 12.0% to 11.9%. It was
mainly due to the increase in total
operating expenses as a percentage
of Group revenue, which offset the
improvement in gross profit margin. The
ratio of EBITDA to revenue was 13.6%,
same as the last financial year.
Total operating expenses were US$408.2
million, an increase of 9.2% over the last
financial year. Correspondingly, total
operating expenses as a percentage of
Group revenue rose from 20.2% to 21.5%.
US$ million %
224.1 218.7 209.5
223.9* 226.1
0
50
100
150
200
250
0
4
8
12
16
20
14.6
10 11
12.8
12
11.7
13
12.0*
14
11.9
Operating profit (US$ million)
Operating profit margin (%)
* Restated
7VTech Holdings Limited Annual Report 2014
Management Discussion and Analysis Financial Review