Vtech 2014 Annual Report Download - page 15
Download and view the complete annual report
Please find page 15 of the 2014 Vtech annual report below. You can navigate through the pages in the report by either clicking on the pages listed below, or by using the keyword search tool below to find specific information within the annual report.-
 1
1 -
2
-
3
-
4
-
 5
5 -
 6
6 -
 7
7 -
 8
8 -
 9
9 -
 10
10 -
 11
11 -
 12
12 -
 13
13 -
 14
14 -
 15
15 -
 16
16 -
 17
17 -
 18
18 -
 19
19 -
 20
20 -
 21
21 -
 22
22 -
 23
23 -
 24
24 -
 25
25 -
26
-
27
-
28
-
29
-
30
-
31
-
32
-
33
-
34
-
35
-
36
-
37
-
38
-
39
-
40
-
41
-
42
-
43
-
44
-
45
-
46
-
47
-
48
-
49
-
50
-
51
-
52
-
53
-
54
-
55
-
56
-
57
-
58
-
59
-
60
-
61
-
62
-
63
-
64
-
65
-
66
-
67
-
68
-
69
-
70
-
71
-
72
 |
 |

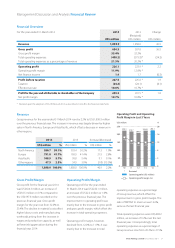
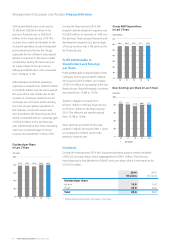
As % of Group RevenueRevenue in Asia Pacific in Last 5 Years
Revenue in Other Regions in Last 5 Years As % of Group Revenue
ASIA PACIFIC
OTHER REGIONS
Group revenue in Asia Pacific increased by 9.1% to US$108.9 million
during the financial year 2014, driven by higher sales among all
product lines. The region represented 5.7% of Group revenue.
ELPs revenue in Asia Pacific increased by 9.2% to
US$21.3 million. Strong growth was seen in China, boosted by
increasing revenues from traditional and online sales channels.
Higher sales were also recorded in Korea, as the Group made
some inroads in the market. Sales in Australia, however,
registered a decline during the financial year 2014.
Revenue from TEL products in the region grew by 8.7% to
US$41.1 million, mainly due to higher sales in Australia, China
and Japan. In Australia, sales rose as VTech increased its share of
the cordless phone market. The Group also started selling baby
monitors to Australian customers, adding to the growth in this
market. Sales in China climbed, as the Group increased market
penetration by introducing more VTech and AT&T branded
products. In Japan, sales growth was driven by the addition of
a new ODM (Original Design Manufacturing) customer.
CMS revenue in Asia Pacific rose by 9.4% to US$46.5 million.
Japan posted higher sales, driven by more orders for marine
radio and medical and health products. Australia also recorded
sales growth, with sales increases in professional audio
equipment, home appliances and medical and health products.
Sales in China and Korea, however, were lower as orders for
solid-state lighting and Bluetooth speakerphones declined.
Other Regions comprise Latin America, the Middle East and
Africa. Group revenue in Other Regions declined by 13.5% to
US$47.5 million, mainly due to lower sales of TEL products and
ELPs. These regions accounted for 2.5% of Group revenue.
ELPs revenue in Other Regions dropped 28.0% to US$13.4 million,
with all regions seeing sales declines, especially Latin America.
Revenue from TEL products in Other Regions fell 7.6% to
US$32.9 million, with Latin America and the Middle East
recording sales decreases during the financial year 2014.
CMS revenue in Other Regions was US$1.2 million in the
financial year 2014, as compared to US$0.7 million in the
financial year 2013.
US$ million
10
81.5
11
98.2
12
94.1 99.8
108.9
13 14
0
30
60
90
120
5.4%
FY2013 FY2014
5.7%
US$ million
10
49.3
11
72.1
12
67.6
54.9
47.5
13 14
0
20
40
60
80
3.0%
FY2013 FY2014
2.5%
13VTech Holdings Limited Annual Report 2014