Vtech 2014 Annual Report Download - page 11
Download and view the complete annual report
Please find page 11 of the 2014 Vtech annual report below. You can navigate through the pages in the report by either clicking on the pages listed below, or by using the keyword search tool below to find specific information within the annual report.-
 1
1 -
 2
2 -
 3
3 -
 4
4 -
 5
5 -
 6
6 -
 7
7 -
 8
8 -
 9
9 -
 10
10 -
 11
11 -
 12
12 -
 13
13 -
 14
14 -
 15
15 -
 16
16 -
 17
17 -
 18
18 -
 19
19 -
 20
20 -
 21
21 -
 22
22 -
23
-
24
-
25
-
26
-
27
-
28
-
29
-
30
-
31
-
32
-
33
-
34
-
35
-
36
-
37
-
38
-
39
-
40
-
41
-
42
-
43
-
44
-
45
-
46
-
47
-
48
-
49
-
50
-
51
-
52
-
53
-
54
-
55
-
56
-
57
-
58
-
59
-
60
-
61
-
62
-
63
-
64
-
65
-
66
-
67
-
68
-
69
-
70
-
71
-
72
 |
 |

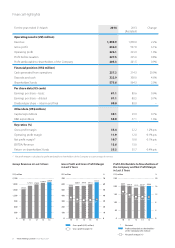
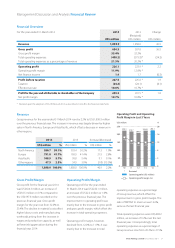
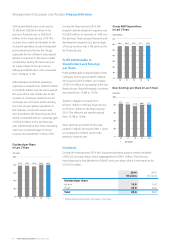
Deposits and Cash in Last 5 Years
(As at 31 March)
Liquidity and Financial
Resources
Shareholders’ funds as at 31 March 2014
were US$575.6 million, an increase of
2.0% from US$564.3 million in the last
financial year. Shareholders’ funds per
share increased by 1.8% from US$2.25 to
US$2.29.
The Group had no borrowings as at
31 March 2013 and 31 March 2014.
The Group’s financial resources remain
strong. As at 31 March 2014, deposits
and cash increased from US$308.6
million to US$322.9 million, an increase
of 4.6% compared with the last financial
year-end-date. It was mainly due to
the increase in cash generated from
operations compared with the same
period last year. The Group has adequate
liquidity to meet its current and future
working capital requirements.
Analysis of Cash Flow from Operations
2014 2013
(Restated)
Change
US$ million US$ million US$ million
Operating profit 226.1 223.9 2.2
Depreciation and amortisation 31.3 29.3 2.0
EBITDA 257.4 253.2 4.2
Gain on disposal of tangible assets (0.1) (0.1) –
Working capital change (0.1) (38.8) 38.7
Cash generated from operations 257.2 214.3 42.9
The Group’s cash generated from operations for the year ended 31 March 2014 was
US$257.2 million, as compared to US$214.3 million in the previous financial year. The
increase was mainly attributable to the increase in EBITDA in the financial year 2014
and the lower working capital investment compared with the previous financial year.
Working Capital Change
Balance as at
31 March 2013
(Restated)
Hedging
and others
Working capital
change per
cash flow
Balance as at
31 March
2014
US$ million US$ million US$ million US$ million
Stocks 276.9 – (11.0) 265.9
Trade debtors 224.9 – (16.3) 208.6
Other debtors, deposits
and prepayments 32.2 (2.4) (2.6) 27.2
Trade creditors (176.2) – 35.4 (140.8)
Other creditors
and accruals (154.4) (4.2) (5.0) (163.6)
Provisions (28.2) – 0.3 (27.9)
Net obligations on
defined benefit
scheme (6.5) 5.2 (0.7) (2.0)
Total working capital 168.7 (1.4) 0.1 167.4
Stocks as of 31 March 2014 were US$265.9 million, decreased from US$276.9 million
as of 31 March 2013. The turnover days fell from 90 days to 87 days. The reduction
resulted from management’s effort to improve stock management.
As at 31 March 2014 and 2013
All figures are in US$ million unless stated otherwise 2014 2013
Stocks 265.9 276.9
Average stocks as a percentage of Group revenue 14.3% 13.9%
Turnover days 87 days 90 days
US$ million
382.6
333.1 326.5
308.6 322.9
10 11 12 13 14
0
50
100
150
200
250
300
350
400
9VTech Holdings Limited Annual Report 2014