Vtech 2013 Annual Report Download - page 9
Download and view the complete annual report
Please find page 9 of the 2013 Vtech annual report below. You can navigate through the pages in the report by either clicking on the pages listed below, or by using the keyword search tool below to find specific information within the annual report.-
 1
1 -
 2
2 -
 3
3 -
 4
4 -
 5
5 -
 6
6 -
 7
7 -
 8
8 -
 9
9 -
 10
10 -
 11
11 -
 12
12 -
 13
13 -
 14
14 -
 15
15 -
 16
16 -
 17
17 -
 18
18 -
 19
19 -
 20
20 -
21
-
22
-
23
-
24
-
25
-
26
-
27
-
28
-
29
-
30
-
31
-
32
-
33
-
34
-
35
-
36
-
37
-
38
-
39
-
40
-
41
-
42
-
43
-
44
-
45
-
46
-
47
-
48
-
49
-
50
-
51
-
52
-
53
-
54
-
55
-
56
-
57
-
58
-
59
-
60
-
61
-
62
-
63
-
64
-
65
-
66
-
67
-
68
-
69
-
70
-
71
-
72
-
73
-
74
-
75
-
76
 |
 |

7
VTech Holdings Ltd Annual Report 2013
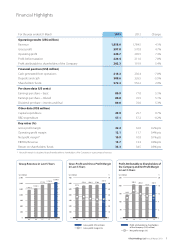
Liquidity and Financial
Resources
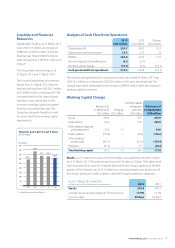
Shareholders’ funds as at 31 March 2013
were US$572.3 million, an increase of
2.9% from US$556.2 million in the last
financial year. Shareholders’ funds per
share increased by 2.7% from US$2.23 to
US$2.29.
The Group had no borrowings as at
31 March 2012 and 31 March 2013.
The Group’s financial resources remain
strong. As at 31 March 2013, deposits
and cash reduced from US$326.5 million
to US$308.6 million, a decrease of 5.5%
compared with the last financial year-
end-date. It was mainly due to the
increase in working capital compared
with the same period last year. The
Group has adequate liquidity to meet
its current and future working capital
requirements.
Analysis of Cash Flow from Operations
2013
US$ million
2012
US$ million
Change
US$ million
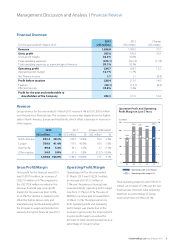
Operatingprofit 224.7 209.5 15.2
Depreciation and amortisation 29.3 27.5 1.8
EBITDA 254.0 237.0 17.0
Gain on disposal of tangible assets (0.1) (0.1) –
Working capital change (39.6) (6.5) (33.1)
Cash generated from operations 214.3 230.4 (16.1)
The Group’s cash generated from operations for the year ended 31 March 2013 was
US$214.3 million, as compared to US$230.4 million in the same period last year. The
change was mainly attributable to the increase in EBITDA, which offset the increase in
working capital investment.
Working Capital Change
Balance as at
31 March 2012
US$ million
Hedging
US$ million
Working capital
change per
cash flow
US$ million
Balance as at
31 March 2013
US$ million
Stocks 239.2 –37.7 276.9
Trade debtors 210.6 –14.3 224.9
Otherdebtors,deposits
and prepayment 33.6 1.0 –34.6
Trade creditors (173.8) –(2.4) (176.2)
Othercreditors
and accruals (141.1) –(13.3) (154.4)
Provisions (31.5) –3.3 (28.2)
Total working capital 137.0 1.0 39.6 177.6
Stocks as of 31 March 2013 were US$276.9 million, increased from US$239.2 million
as of 31 March 2012. The turnover days rose from 82 days to 90 days. The higher stock
level was primarily to cater for increased demand for the Group’s products in the first
quarter of the financial year 2014. Furthermore, we had arranged early production of
the Group’s products in order to better utilise the Group’s production capacities.
As at 31 March 2013 and 2012
All figures are in US$ million unless stated otherwise 2013 2012
Stocks 276.9 239.2
Average stocks as a percentage of Group revenue 13.9% 13.1%
Turnover days 90 days 82 days
450
400
350
300
250
200
150
100
50
0
US$ million
09 10 11 12 13
292.1*
* Include currency-linked deposits
382.6
333.1 326.5
308.6
Deposits and Cash in Last 5 Years
(As at 31 March)
vtech.indb 7 13年5月29日 上午3:17