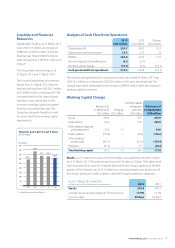
Vtech 2013 Annual Report Download - page 19
Download and view the complete annual report
Please find page 19 of the 2013 Vtech annual report below. You can navigate through the pages in the report by either clicking on the pages listed below, or by using the keyword search tool below to find specific information within the annual report.-
 1
1 -
2
-
3
-
4
-
5
-
6
-
7
-
8
-
 9
9 -
 10
10 -
 11
11 -
 12
12 -
 13
13 -
 14
14 -
 15
15 -
 16
16 -
 17
17 -
 18
18 -
 19
19 -
 20
20 -
 21
21 -
 22
22 -
 23
23 -
 24
24 -
 25
25 -
 26
26 -
 27
27 -
 28
28 -
 29
29 -
30
-
31
-
32
-
33
-
34
-
35
-
36
-
37
-
38
-
39
-
40
-
41
-
42
-
43
-
44
-
45
-
46
-
47
-
48
-
49
-
50
-
51
-
52
-
53
-
54
-
55
-
56
-
57
-
58
-
59
-
60
-
61
-
62
-
63
-
64
-
65
-
66
-
67
-
68
-
69
-
70
-
71
-
72
-
73
-
74
-
75
-
76
 |
 |

17
VTech Holdings Ltd Annual Report 2013
US$361.9 million
+17.3%
49.5%
NORTH AMERICA
Sales:
Year-on-Year Change:
% of ELPs Revenue: % of ELPs Revenue:
US$331.3 million
45.3%
EUROPE
OTHER REGIONS
US$18.6 million
2.5%
Sales:
Year-on-Year Change:
Sales:
% of ELPs Revenue:
US$19.5 million
2.7%
ASIA PACIFIC
Sales:
Year-on-Year Change: +6.8%
-10.6% Year-on-Year Change: +11.4%
% of ELPs Revenue:
12 Source: NPD Group, Retail Tracking Service. Ranking based on total retail sales in the toy categories of infant electronic learning and preschool electronic
learning, for the combined market of US, UK, France, Germany and Spain
OUR COMPETITIVE EDGE
Product
Innovation
Global Market
Leadership
Integrated
Design
Manufacturer
30+ Years of
Experience
OUR GEOGRAPHICAL PRESENCE
supplier of ELPs from
infancy to preschool in the
US and Western Europe 12 43
million products*
sold to 84 markets,
covering 24 languages
* Includes all platform and standalone products, software cartridges, accessories and download apps
No.1
vtech.indb 17 13年5月29日 上午3:18