Vtech 2013 Annual Report Download - page 4
Download and view the complete annual report
Please find page 4 of the 2013 Vtech annual report below. You can navigate through the pages in the report by either clicking on the pages listed below, or by using the keyword search tool below to find specific information within the annual report.-
 1
1 -
 2
2 -
 3
3 -
 4
4 -
 5
5 -
 6
6 -
 7
7 -
 8
8 -
 9
9 -
 10
10 -
 11
11 -
 12
12 -
 13
13 -
 14
14 -
 15
15 -
16
-
17
-
18
-
19
-
20
-
21
-
22
-
23
-
24
-
25
-
26
-
27
-
28
-
29
-
30
-
31
-
32
-
33
-
34
-
35
-
36
-
37
-
38
-
39
-
40
-
41
-
42
-
43
-
44
-
45
-
46
-
47
-
48
-
49
-
50
-
51
-
52
-
53
-
54
-
55
-
56
-
57
-
58
-
59
-
60
-
61
-
62
-
63
-
64
-
65
-
66
-
67
-
68
-
69
-
70
-
71
-
72
-
73
-
74
-
75
-
76
 |
 |

2VTech Holdings Ltd Annual Report 2013
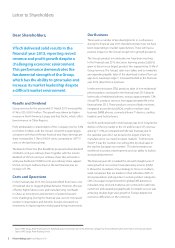
Letter to Shareholders
Our Business
There were a number of key developments in our business
during the financial year 2013 that demonstrate how we have
been responding to market opportunities. These will have a
positive impact on the Group’s longer-term growth prospects.
The Group’s product mix and sales mix have been evolving.
In the financial year 2013, electronic learning products (ELPs)
grew to become our largest product line, representing 39.3% of
Group revenue. The Group’s sales via e-tailers and our websites
are expanding rapidly. Sales of the download content from our
app store, Learning Lodge TM, increased fivefold in the financial
year 2013, albeit from a low base.
In telecommunication (TEL) products, sales of non-residential-
phone products increased in the financial year 2013 despite
lower sales of residential phones, rising to approximately 12%
of total TEL products revenue, from approximately 8% in the
financial year 2012. These products consist of baby monitors,
integrated access devices (IADs), small to medium sized
business (SMB) phones, connected home TM devices, cordless
headsets and hotel phones.
OurELPsperformedwellinthefinancialyear2013.Despitethe
decline of the toy market in the US and Europe, ELPs revenue
grew by 11.3% as compared with the last financial year. In
the calendar year 2012, we became the largest infant toy
manufacturer in our main European markets 1. Furthermore,
Storio® 2 was the number one selling item by retail value in
the top five European toy markets 2. This demonstrates our
excellence in product development, and our ability to build a
strong brand presence.
The financial year 2013 marked the eleventh straight year of
sales growth at our contract manufacturing services (CMS).
It shows the soundness of our strategy to focus on medium-
sized companies that are leaders in their industries. With its
strong reputation and expertise in certain product categories,
CMS once again outperformed the global EMS (electronic
manufacturing services) market as we continued to add new
customers and expand geographically. A notable success was
achieving double-digit sales growth in Europe despite the
economic difficulties on the continent.
1 Source: NPD Group, Retail Tracking Service. Ranking based on total retail sales in the Infant Toys category, for the combined market of UK, France, Germany and Spain
2 Source: NPD Group, Retail Tracking Service
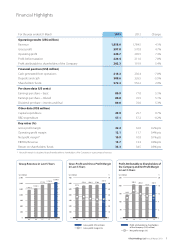
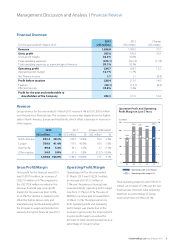
Results and Dividend
Group revenue for the year ended 31 March 2013 increased by
4.1% to US$1,858.0 million. The growth was driven by higher
revenue in North America, Europe and Asia Pacific, which offset
lowerrevenueinOtherRegions.
Profit attributable to shareholders of the Company rose by 5.4%
to US$202.3 million, with the Group’s net profit margin largely
consistent with that of the last financial year. Basic earnings per
share increased by 5.1% to US80.9 cents, compared to US77.0
cents in the last financial year.
The Board of Directors (the Board) has proposed a final dividend
of US64.0 cents per ordinary share. Together with the interim
dividend of US16.0 cents per ordinary share, this will result in
a full-year dividend of US80.0 cents per ordinary share, against
US76.0 cents per ordinary share in the last financial year, an
increase of 5.3%.
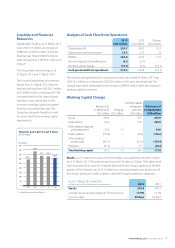
Costs and Operations
In the financial year 2013, the Group benefited from lower cost
of materials due to sluggish global demand. However, this was
offset by higher labour costs and manufacturing overheads
in China, as recruitment and retention of workers became
more challenging. During the financial year, we not only raised
workers’ compensation and benefits, but also increased our
investment in improving their working and living environment.
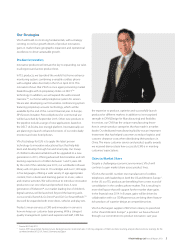
VTech delivered solid results in the
financial year 2013, reporting record
revenue and profit growth despite a
challenging economic environment.
This performance demonstrates the
fundamental strength of the Group,
which has the ability to grow sales and
increase its market leadership despite
a difficult market environment.
Dear Shareholders,
vtech.indb 2 13年5月29日 上午3:16