Vtech 2013 Annual Report Download - page 12
Download and view the complete annual report
Please find page 12 of the 2013 Vtech annual report below. You can navigate through the pages in the report by either clicking on the pages listed below, or by using the keyword search tool below to find specific information within the annual report.-
 1
1 -
 2
2 -
 3
3 -
 4
4 -
 5
5 -
 6
6 -
 7
7 -
 8
8 -
 9
9 -
 10
10 -
 11
11 -
 12
12 -
 13
13 -
 14
14 -
 15
15 -
 16
16 -
 17
17 -
 18
18 -
 19
19 -
 20
20 -
 21
21 -
 22
22 -
23
-
24
-
25
-
26
-
27
-
28
-
29
-
30
-
31
-
32
-
33
-
34
-
35
-
36
-
37
-
38
-
39
-
40
-
41
-
42
-
43
-
44
-
45
-
46
-
47
-
48
-
49
-
50
-
51
-
52
-
53
-
54
-
55
-
56
-
57
-
58
-
59
-
60
-
61
-
62
-
63
-
64
-
65
-
66
-
67
-
68
-
69
-
70
-
71
-
72
-
73
-
74
-
75
-
76
 |
 |

10 VTech Holdings Ltd Annual Report 2013
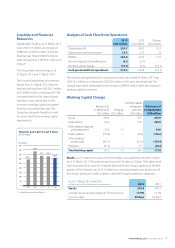
Management Discussion and Analysis Review of Operations
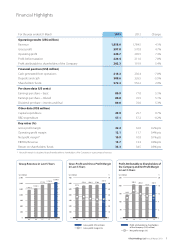
EUROPE
Group revenue in Europe increased by
7.0% to US$769.9 million. As in North
America, the growth was attributable to
higher revenue of ELPs and CMS in the
region, offsetting lower revenue of TEL
products. Europe was VTech’s second
largest market, accounting for 41.4% of
Group revenue.
Revenue from TEL products declined by
5.5% to US$203.6 million. The decrease
in revenue was primarily due to lower
sales of residential phones, as customers
reduced orders and inventory in view of
the weak economies. This was especially
true in the first half of the financial year,
while improvement was seen in the
second half due to restocking by some
customers. In the calendar year 2012,
VTech maintained its leadership position
as the largest manufacturer of cordless
phones in Western Europe 8.
Despite lower sales of residential phones,
sales of non-residential-phone products
continued to rise. These included baby
monitors, IADs, connected home devices
and hotel phones.
ELPs revenue in Europe was US$331.3
million, up 6.8%, despite being
negatively impacted by a lower average
Euro-US Dollar exchange rate compared
to the last financial year. As in North
America, the children’s educational tablet
Storio 2, Switch & Go Dinos and infant
products, including the new Toot-Toot
Drivers® range, were the growth drivers.
During the financial year 2013, Storio 2
was sold in all VTech’s major markets in
Europe. It was the number one selling
item by retail revenue in the top five
European toy markets in the calendar
year 2012 9. In the same calendar year,
the Kidizoom digital camera also topped
the best selling toy list in Germany 10.
ELPs sales were higher in the UK, France
and Germany while sales in Spain were
lower. In the Benelux countries, sales
grew in Euro terms but declined in US
dollar terms owing to adverse changes in
the exchange rate.
CMS revenue in Europe rose by 21.4%
to US$235.0 million, driven by sales
growth in almost all product categories.
Medical and health products posted
the strongest growth in the region,
buoyed by increased sales to existing
and new customers. Wireless headsets
also delivered robust results, as VTech
benefited from the customer’s new
product launches and consolidation
of suppliers. Switching mode power
supplies and professional audio
equipment demonstrated solid growth,
driven by more orders for solar power
inverters and increased orders from new
German customers respectively. Sales of
industrial products, however, recorded a
decline during the financial year 2013.
8 Source: MZA Ltd, 2013 edition of The Global Telecommunications Market Report
9 & 10 Source: NPD Group, Retail Tracking Service
TEL Products
26.5%
US$203.6 million
ELPs
43.0%
US$331.3 million
CMS
30.5%
US$235.0 million
Total: US$769.9 million
Revenue in Europe in Last 5 Years
800
600
400
200
0
US$ million
09 10 11 12 13
570.5 528.9
667.6
719.3
769.9
Revenue in Europe by
Product Line
for the year ended 31 March 2013
vtech.indb 10 13年5月29日 上午3:17