Vtech 2013 Annual Report Download - page 11
Download and view the complete annual report
Please find page 11 of the 2013 Vtech annual report below. You can navigate through the pages in the report by either clicking on the pages listed below, or by using the keyword search tool below to find specific information within the annual report.-
 1
1 -
 2
2 -
 3
3 -
 4
4 -
 5
5 -
 6
6 -
 7
7 -
 8
8 -
 9
9 -
 10
10 -
 11
11 -
 12
12 -
 13
13 -
 14
14 -
 15
15 -
 16
16 -
 17
17 -
 18
18 -
 19
19 -
 20
20 -
 21
21 -
 22
22 -
23
-
24
-
25
-
26
-
27
-
28
-
29
-
30
-
31
-
32
-
33
-
34
-
35
-
36
-
37
-
38
-
39
-
40
-
41
-
42
-
43
-
44
-
45
-
46
-
47
-
48
-
49
-
50
-
51
-
52
-
53
-
54
-
55
-
56
-
57
-
58
-
59
-
60
-
61
-
62
-
63
-
64
-
65
-
66
-
67
-
68
-
69
-
70
-
71
-
72
-
73
-
74
-
75
-
76
 |
 |

9
VTech Holdings Ltd Annual Report 2013
Management Discussion and Analysis Review of Operations
NORTH AMERICA
Group revenue in North America
increased by 3.3% to US$933.4 million
in the financial year 2013, as higher
revenue from ELPs and CMS offset
lower revenue from TEL products.
North America remained VTech’s largest
market, accounting for 50.2% of
Group revenue.
Revenue from TEL products was down
by 6.2% to US$389.4 million. The
decline was mainly due to lower sales
of residential phones. The US residential
cordless phone market is mature, while
demand in the first half of the financial
year was affected by weak US economic
growth. In the second half, consumer
demand steadily improved due to the
continuing recovery of the US housing
market, resulting in a more modest year-
on-year sales decline as compared with
the first half of the financial year. During
the year under review, VTech maintained
its number one position in the US
residential phone market 6.
Sales of non-residential-phone products,
including SMB phones, baby monitors,
hotel phones and cordless headsets,
continued to rise. The growth was
driven by baby monitors, a full-year sales
contribution from hotel phones and
higher sales of SynJ® and Synapse® SMB
phone systems. The new four-line Small
Business System, which was shipped
in September 2012, was well-received
by the market. CareLine, a home safety
telephone system for seniors, has also
received an encouraging response since
itslaunchinOctober2012.
ELPs revenue in North America rose by
17.3% to US$361.9 million in the financial
year 2013. Higher sales were achieved
for both platform and standalone
products. Among platform products,
sales of InnoTab®, our educational tablet
designed specifically for children, grew
strongly. This robust performance was
driven by a full-year sales contribution
of the product line and the launch of
three second generation consoles,
InnoTab® 2, InnoTab® 2S and InnoTab®
Baby. An expanded software library,
with cartridges and download content
comprising over 400 titles in English and
French, also contributed to growth. Sales
of MobiGo® 2 and V.Reader®, however,
declined due to the popularity of tablets.
For standalone products, infant products
and the new range Switch & Go Dinos
were the key growth drivers. Switch &
Go Dinos are interactive preschool toys
that transform between dinosaurs and
vehicles. They hit US retailer shelves in
May 2012 and sold strongly through
the holiday seasons. With less than a
full year’s sales, two Switch & Go Dinos
items ranked among the five top selling
products in NPD’s Preschool Vehicles
category in the US for calendar year
2012 7. Among new infant products,
the vehicle line Go! Go! Smart Wheels
and Alphabet Activity Cube™ were the
leading contributors.
CMS revenue in North America increased
by 1.3% to US$182.1 million. Sales of
professional audio equipment, the
largest product category in the region,
grew slightly as the customer worked
through inventory and orders picked up
in the second half of the financial year.
TEL Products
41.7%
US$389.4 million
ELPs
38.8%
US$361.9 million
CMS
19.5%
US$182.1 million
Total: US$933.4 million
6 Source: MarketWise Consumer Insights, LLC
7 Source: NPD Group, Retail Tracking Service
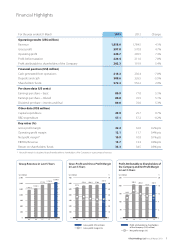
Revenue in North America
in Last 5 Years
1,000
800
600
400
200
0
US$ million
09 10 11 12 13
772.8
872.6 874.9 903.5
933.4
Revenue in North America
by Product Line
for the year ended 31 March 2013
Sales of industrial products, commercial
solid-state lighting and home appliances
were also higher, driven by more orders
from existing customers. Sales of internet
phones for office use, however, were
down due to a change in the customer’s
inventory management policy.
vtech.indb 9 13年5月29日 上午3:17