Vtech 2013 Annual Report Download - page 13
Download and view the complete annual report
Please find page 13 of the 2013 Vtech annual report below. You can navigate through the pages in the report by either clicking on the pages listed below, or by using the keyword search tool below to find specific information within the annual report.-
 1
1 -
2
-
 3
3 -
 4
4 -
 5
5 -
 6
6 -
 7
7 -
 8
8 -
 9
9 -
 10
10 -
 11
11 -
 12
12 -
 13
13 -
 14
14 -
 15
15 -
 16
16 -
 17
17 -
 18
18 -
 19
19 -
 20
20 -
 21
21 -
 22
22 -
 23
23 -
24
-
25
-
26
-
27
-
28
-
29
-
30
-
31
-
32
-
33
-
34
-
35
-
36
-
37
-
38
-
39
-
40
-
41
-
42
-
43
-
44
-
45
-
46
-
47
-
48
-
49
-
50
-
51
-
52
-
53
-
54
-
55
-
56
-
57
-
58
-
59
-
60
-
61
-
62
-
63
-
64
-
65
-
66
-
67
-
68
-
69
-
70
-
71
-
72
-
73
-
74
-
75
-
76
 |
 |

11
VTech Holdings Ltd Annual Report 2013
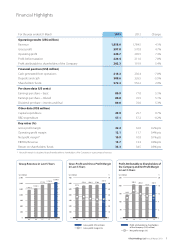
ASIA PACIFIC
OTHER REGIONS
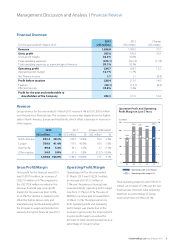
Group revenue in Asia Pacific increased
by 6.1% to US$99.8 million. The sales
growth was attributable to higher sales
of TEL products and ELPs, offsetting
a sales decrease in CMS. The region
accounted for 5.4% of Group revenue.
Revenue from TEL products was up by
27.7% to US$37.8 million. The increase
in revenue was mainly due to the rise in
orders from Japanese customers as they
recovered from the earthquake in March
2011. Sales in Australia were also higher,
as a new product line was launched
in the second half of the financial year,
resulting in a pick-up in sales.
ELPs revenue in Asia Pacific increased
by 11.4% to US$19.5 million. The growth
was mainly driven by higher sales of
standalone products in China, Japan
and Korea, as VTech continued to make
progress in those countries. Shipment
to Australia, the Group’s largest market
for ELPs in Asia Pacific, was slightly down
during the financial year 2013.
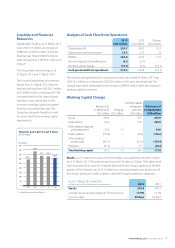
OtherregionsincludeLatinAmerica,the
Middle East and Africa. Group revenue
in other regions fell by 18.8% to US$54.9
million. The decline was due to lower sales
inallregionsandproductlines.Other
regions represented 3.0% of Group revenue.
Revenue from TEL products decreased by
22.6% to US$35.6 million, as sales growth
in the Middle East was more than offset by
sales declines in Latin America and Africa.
ELPs revenue in other regions was down
by 10.6% to US$18.6 million. All regions
recorded sales declines during the financial
year 2013.
CMS revenue in other regions was US$0.7
million, down 12.5% as compared to the
last financial year.
CMS revenue in Asia Pacific decreased
by 9.6% to US$42.5 million. Higher sales
in China were more than offset by lower
revenue in Japan and Korea. In China,
the dedicated manufacturing facility
enabled CMS to grow sales rapidly as
it helps customers to distribute their
commercial solid-state lighting in the
domestic market more efficiently. In
Japan, however, higher sales of marine
radio were unable to compensate for
lower revenue from LED light bulbs,
medical and health products and
handheld radiation detectors. In Korea,
orders for Bluetooth speaker phones
slowed down in the second half due to
market competition, which resulted in a
sales decline for the full financial year.
TEL Products
37.9%
US$37.8 million
TEL Products
64.8%
US$35.6 million
ELPs
19.5%
US$19.5 million
ELPs
33.9%
US$18.6 million
CMS
42.6%
US$42.5 million
CMS
1.3%
US$0.7 million
Total: US$99.8 million
Total: US$54.9 million
Revenue in Asia Pacific
in Last 5 Years
Revenue in Other Regions
in Last 5 Years
100
80
60
40
20
0
80
60
40
20
0
US$ million
US$ million
09
09
10
10
11
11
12
12
13
13
55.2
49.7
81.5
49.3
98.2
72.1
94.1
67.6
99.8
54.9
Revenue in Asia Pacific
by Product Line
for the year ended 31 March 2013
Revenue in Other Regions
by Product Line
for the year ended 31 March 2013
vtech.indb 11 13年5月29日 上午3:17