Vtech 2011 Annual Report Download - page 13
Download and view the complete annual report
Please find page 13 of the 2011 Vtech annual report below. You can navigate through the pages in the report by either clicking on the pages listed below, or by using the keyword search tool below to find specific information within the annual report.-
 1
1 -
2
-
 3
3 -
 4
4 -
 5
5 -
 6
6 -
 7
7 -
 8
8 -
 9
9 -
 10
10 -
 11
11 -
 12
12 -
 13
13 -
 14
14 -
 15
15 -
 16
16 -
 17
17 -
 18
18 -
 19
19 -
 20
20 -
 21
21 -
 22
22 -
 23
23 -
24
-
25
-
26
-
27
-
28
-
29
-
30
-
31
-
32
-
33
-
34
-
35
-
36
-
37
-
38
-
39
-
40
-
41
-
42
-
43
-
44
-
45
-
46
-
47
-
48
-
49
-
50
-
51
-
52
-
53
-
54
-
55
-
56
-
57
-
58
-
59
-
60
-
61
-
62
-
63
-
64
-
65
-
66
-
67
-
68
 |
 |

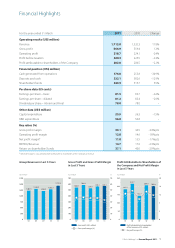
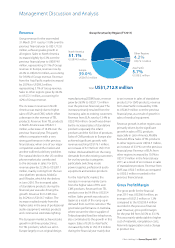
TEL Products
48.1%
US$421.1 million
ELPs
32.8%
US$287.1 million
CMS
19.1%
US$166.7 million
Revenue in North America by Product Line
for the year ended 31 March 2011
Total: US$874.9 million
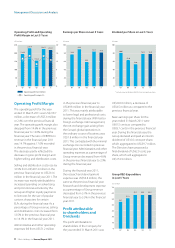
Revenue in Last 5 Years
US$ million
100
200
300
400
500
600
700
0
800
07
660.6
08
688.0
09
620.7
10
742.3
11
727.5
Revenue in Last 5 Years
US$ million
100
200
300
400
500
600
0
700
07
570.1
08
615.7
09
566.9
10
508.7
11
594.9
Revenue in Last 5 Years
US$ million
100
200
300
400
0
500
07 08
248.3
233.1
09
260.6
10
281.3
11
390.4
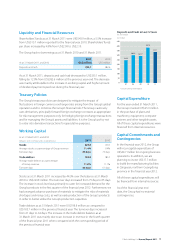
TEL Products
32.6%
US$217.5 million
ELPs
41.0%
US$274.0 million
CMS
26.4%
US$176.1 million
Revenue in Europe by Product Line
for the year ended 31 March 2011
Total: US$667.6 million
TEL Products
36.0%
US$35.4 million
ELPs
16.2%
US$15.9 million
CMS
47.8%
US$46.9 million
Revenue in Asia Pacific by Product Line
for the year ended 31 March 2011
Total: US$98.2 million
TEL Products
74.2%
US$53.5 million
ELPs
24.8%
US$17.9 million
CMS
1.0%
US$0.7 million
Revenue in Other Regions by Product Line
for the year ended 31 March 2011
Total: US$72.1 million
VTech Holdings Ltd Annual Report 2011 11