Vtech 2011 Annual Report Download - page 11
Download and view the complete annual report
Please find page 11 of the 2011 Vtech annual report below. You can navigate through the pages in the report by either clicking on the pages listed below, or by using the keyword search tool below to find specific information within the annual report.-
 1
1 -
 2
2 -
 3
3 -
 4
4 -
 5
5 -
 6
6 -
 7
7 -
 8
8 -
 9
9 -
 10
10 -
 11
11 -
 12
12 -
 13
13 -
 14
14 -
 15
15 -
 16
16 -
 17
17 -
 18
18 -
 19
19 -
 20
20 -
 21
21 -
 22
22 -
23
-
24
-
25
-
26
-
27
-
28
-
29
-
30
-
31
-
32
-
33
-
34
-
35
-
36
-
37
-
38
-
39
-
40
-
41
-
42
-
43
-
44
-
45
-
46
-
47
-
48
-
49
-
50
-
51
-
52
-
53
-
54
-
55
-
56
-
57
-
58
-
59
-
60
-
61
-
62
-
63
-
64
-
65
-
66
-
67
-
68
 |
 |

VTech Holdings Ltd Annual Report 2011 9
Liquidity and Financial Resources
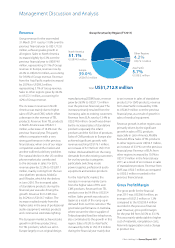
Shareholders’ funds as at 31 March 2011 were US$543.9 million, a 5.5% increase
from US$515.7 million reported for the financial year 2010. Shareholders’ funds
per share increased by 4.8% from US$2.09 to US$2.19.
The Group had no borrowings as at 31 March 2010 and 31 March 2011.
As at 31 March 2011 and 2010
2011
US$ million
2010
US$ million
Deposits and cash 333.1 382.6
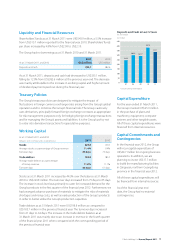
As at 31 March 2011, deposits and cash had decreased to US$333.1 million,
falling by 12.9% from US$382.6 million at the previous year-end. The decrease
was mainly attributable to the increase in working capital and higher amount
of dividend payments paid out during the financial year.
Treasury Policies
The Group’s treasury policies are designed to mitigate the impact of
fluctuations in foreign currency exchange rates arising from the Group’s global
operations and to minimise the Group’s financial risks. The Group cautiously
uses derivatives, principally forward foreign exchange contracts as appropriate
for risk management purposes only, for hedging foreign exchange transactions
and for managing the Group’s assets and liabilities. It is the Group’s policy not
to enter into derivative transactions for speculative purposes.
Working Capital
As at 31 March 2011 and 2010
All figures are in US$ million unless stated otherwise 2011 2010
Stocks 229.8 159.3
Average stocks as a percentage of Group revenue 11.4% 9.4%
Turnover days 85 days 75 days
Trade debtors 198.8 185.7
Average trade debtors as a percentage
of Group revenue 11.2% 11.1%
Turnover days 63 days 61 days
Stocks as at 31 March 2011 increased by 44.3% over the balance at 31 March
2010 to US$229.8 million. The turnover days increased from 75 days to 85 days.
The increase in stock level was primarily to cater for increased demand for the
Group’s products in the first quarter of the financial year 2012. Furthermore, we
had arranged advance purchase of materials to mitigate the risks of materials
shortages and rising costs, as well as early production of the Group’s products
in order to better utilise the Group’s production capacities.
Trade debtors as at 31 March 2011 were US$198.8 million as compared to
US$185.7 million in the previous financial year. The turnover days increased
from 61 days to 63 days. The increase in the trade debtor balance as at
31 March 2011 was mainly due to an increase in revenue in the fourth quarter
of the financial year 2011 when compared with the corresponding period of
the previous financial year.
Capital Expenditure
For the year ended 31 March 2011,
the Group invested US$25.9 million
in the purchase of plant and
machinery, equipment, computer
systems and other tangible assets.
All of these capital expenditures were
financed from internal resources.
Capital Commitments and
Contingencies
In the financial year 2012, the Group
will incur capital expenditure of
US$44.7 million for ongoing business
operations. In addition, we are
planning to invest US$17.7 million
to build the manufacturing facilities
in Qingyuan, northern Guangdong
province in the financial year 2012.
All of these capital expenditures will
be financed from internal resources.
As of the financial year end
date, the Group had no material
contingencies.
50
100
150
200
250
300
350
400
0
450
07
246.5
08
300.1*
09
292.1*
10
382.6
11
333.1
Deposits and Cash in Last 5 Years
(As at 31 March)
US$ million
* Include currency-linked deposits