Vonage 2014 Annual Report Download - page 38
Download and view the complete annual report
Please find page 38 of the 2014 Vonage annual report below. You can navigate through the pages in the report by either clicking on the pages listed below, or by using the keyword search tool below to find specific information within the annual report.-
 1
1 -
2
-
3
-
4
-
5
-
6
-
7
-
8
-
9
-
10
-
11
-
12
-
13
-
14
-
15
-
16
-
17
-
18
-
19
-
20
-
21
-
22
-
23
-
24
-
25
-
26
-
27
-
 28
28 -
 29
29 -
 30
30 -
 31
31 -
 32
32 -
 33
33 -
 34
34 -
 35
35 -
 36
36 -
 37
37 -
 38
38 -
 39
39 -
 40
40 -
 41
41 -
 42
42 -
 43
43 -
 44
44 -
 45
45 -
 46
46 -
 47
47 -
 48
48 -
49
-
50
-
51
-
52
-
53
-
54
-
55
-
56
-
57
-
58
-
59
-
60
-
61
-
62
-
63
-
64
-
65
-
66
-
67
-
68
-
69
-
70
-
71
-
72
-
73
-
74
-
75
-
76
-
77
-
78
-
79
-
80
-
81
-
82
-
83
-
84
-
85
-
86
-
87
-
88
-
89
-
90
-
91
-
92
-
93
-
94
-
95
-
96
-
97
-
98
-
99
-
100
 |
 |

Table of Contents
34 VONAGE ANNUAL REPORT 2014
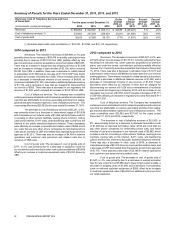
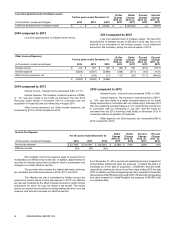
Loss from abandonment of software assets
For the years ended December 31, Dollar
Change
2014 vs.
2013
Dollar
Change
2013 vs.
2012
Percent
Change
2014 vs.
2013
Percent
Change
2013 vs.
2012
(in thousands, except percentages) 2014 2013 2,012
Loss from abandonment of software assets $ — $ — $ 25,262 $ — $ (25.262) —% (100)%
2014 compared to 2013
Loss from abandonment of software assets. None.
2013 compared to 2012
Loss from abandonment of software assets. The loss from
abandonment of software assets of $25,262 in 2012 was due to the
write-off of our investment in the Amdocs system, net of settlement
amounts to the Company, during the second quarter of 2012.
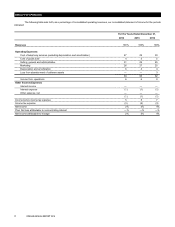
Other Income (Expense)
For the years ended December 31, Dollar
Change
2014 vs.
2013
Dollar
Change
2013 vs.
2012
Percent
Change
2014 vs.
2013
Percent
Change
2013 vs.
2012
(in thousands, except percentages) 2014 2013 2012
Interest income $ 212 $ 307 $109 $(95) $ 198 (31)% 182 %
Interest expense (6,823) (6,557) (5,986) (266)(571) (4)% (10)%
Other income (expense), net 11 (104)(11)115 (93)111 % (845)%
$ (6,600) $ (6,354) $ (5,888)
2014 compared to 2013
Interest income. Interest income decreased $95, or 31%.
Interest expense. The increase in interest expense of $266,
or 4%, was due mainly to the funds we borrowed from the 2013
Revolving Credit Facility in November 2013 in connection with the
acquisition of Vocalocity and our refinancing in August 2014.
Other income (expense), net. Other income (expense), net
increased by $115 in 2014 compared to 2013.
2013 compared to 2012
Interest income. Interest income increased $198, or 182%.
Interest expense. The increase in interest expense of $571,
or 10%, was due mainly to a higher principal balance on our credit
facility entered into in connection with our refinancing in February 2013
than the remaining principal balance on our credit facility entered into
in connection with our refinancing in July 2011 and the funds we
borrowed from the 2013 revolving credit facility in November 2013 in
connection with the acquisition of Vocalocity.
Other expense, net. Other expense, net increased by $93 in
2013 compared to 2012.
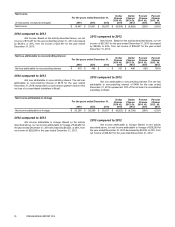
Income Tax Expense
For the years ended December 31, Dollar
Change
2014 vs.
2013
Dollar
Change
2013 vs.
2012
Percent
Change
2014 vs.
2013
Percent
Change
2013 vs.
2012
(in thousands, except percentages) 2014 2013 2012
Income tax expense $ (21,760) $ (18,194) $ (22,095) $ (3,566) $ 3,901 (20)% 18%
Effective tax rate 53% 39% 38%
We recognize income tax expense equal to pre-tax income
multiplied by our effective income tax rate. In addition, adjustments are
recorded for discrete period items related to stock compensation and
changes to our state effective tax rate.
The provision also includes the federal alternative minimum
tax and state and local income taxes in 2014, 2013, and 2012.
The effective tax rate is calculated by dividing income tax
expense by income before income tax expense. In 2014, our effective
tax rate was impacted by the effect of losses incurred in certain foreign
jurisdictions for which we may not realize a tax benefit. The losses
reduce our pre-tax income without a corresponding reduction in our tax
expense, and therefore increase our effective tax rate.
As of December 31, 2014, we had net operating loss carry forwards for
United States federal and state tax purposes, including the NOLs of
Vocalocity as of the date of acquisition, of $639,981 and $214,238,
respectively, expiring at various times from years ending 2013 through
2033. In addition, we had net operating loss carry forwards for Canadian
tax purposes of $4,458 expiring through 2027. We also had net operating
loss carry forwards for United Kingdom tax purposes of $44,853 with
no expiration date.