Vonage 2014 Annual Report Download - page 32
Download and view the complete annual report
Please find page 32 of the 2014 Vonage annual report below. You can navigate through the pages in the report by either clicking on the pages listed below, or by using the keyword search tool below to find specific information within the annual report.-
 1
1 -
2
-
3
-
4
-
5
-
6
-
7
-
8
-
9
-
10
-
11
-
12
-
13
-
14
-
15
-
16
-
17
-
18
-
19
-
20
-
21
-
 22
22 -
 23
23 -
 24
24 -
 25
25 -
 26
26 -
 27
27 -
 28
28 -
 29
29 -
 30
30 -
 31
31 -
 32
32 -
 33
33 -
 34
34 -
 35
35 -
 36
36 -
 37
37 -
 38
38 -
 39
39 -
 40
40 -
 41
41 -
 42
42 -
43
-
44
-
45
-
46
-
47
-
48
-
49
-
50
-
51
-
52
-
53
-
54
-
55
-
56
-
57
-
58
-
59
-
60
-
61
-
62
-
63
-
64
-
65
-
66
-
67
-
68
-
69
-
70
-
71
-
72
-
73
-
74
-
75
-
76
-
77
-
78
-
79
-
80
-
81
-
82
-
83
-
84
-
85
-
86
-
87
-
88
-
89
-
90
-
91
-
92
-
93
-
94
-
95
-
96
-
97
-
98
-
99
-
100
 |
 |

Table of Contents
28 VONAGE ANNUAL REPORT 2014
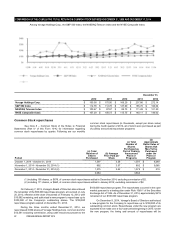
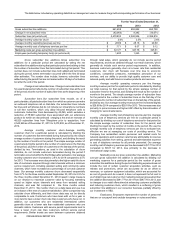
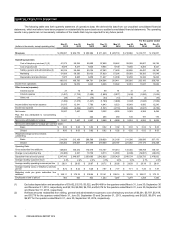
The table below includes key operating data that our management uses to measure the growth and operating performance of our business:
For the Years Ended December 31,
2014 2013 2012
Gross subscriber line additions 661,608 652,852 652,750
Change in net subscriber lines (42,065) 9,392 (15,071)
Subscriber lines (at period end) 2,470,832 2,542,926 2,359,816
Average monthly customer churn 2.6% 2.5% 2.6%
Average monthly operating revenues per line $ 28.89 $28.18 $29.89
Average monthly cost of telephony services per line $ 7.71 $8.07 $9.12
Marketing costs per gross subscriber line addition $ 341.77 $ 347.78 $325.61
Employees (excluding temporary help) (at period end) 1,400 1,243 983
Gross subscriber line additions. Gross subscriber line
additions for a particular period are calculated by taking the net
subscriber line additions during that particular period and adding to that
the number of subscriber lines that terminated during that period. This
number does not include subscriber lines both added and terminated
during the period, where termination occurred within the first 30 days
after activation. The number does include, however, subscriber lines
added during the period that are terminated within 30 days of activation
but after the end of the period.
Change in net subscriber lines. Change in net subscriber lines
for a particular period reflects the number of subscriber lines at the end
of the period, less the number of subscriber lines at the beginning of the
period.
Subscriber lines. Our subscriber lines include, as of a
particular date, all paid subscriber lines from which a customer can make
an outbound telephone call on that date. Our subscriber lines include
fax lines and soft phones but do not include our virtual phone numbers
or toll free numbers, which only allow inbound telephone calls to
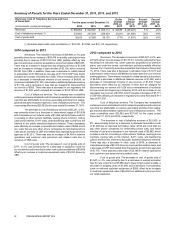
customers. Subscriber lines decreased by 42,065, which excludes a
reduction of 78,949 subscriber lines associated with our extensions
product for which we discontinued charging a fee and an increase of
48,920 subscriber lines from Telesphere prior to acquisition, from
2,542,926 as of December 31, 2013 to 2,470,832, as of December 31,
2014.
Average monthly customer churn. Average monthly
customer churn for a particular period is calculated by dividing the
number of customers that terminated during that period by the simple
average number of customers during the period, and dividing the result
by the number of months in the period. The simple average number of
customers during the period is the number of customers on the first day
of the period, plus the number of customers on the last day of the period,
divided by two. Terminations, as used in the calculation of churn
statistics, do not include customers terminated during the period if
termination occurred within the first 30 days after activation. Our average
monthly customer churn increased to 2.6% for 2014 compared to 2.5%
for 2013. The increases were due primarily to the higher early life churn
rate of customers acquired through retail channels without a minimum
service requirement, including assisted selling and community sales
channels, which have increased as a percentage of our total customer
base. Our average monthly customer churn decreased sequentially
from 2.7% for the three months ended September 30, 2014 to 2.5% for
the three months ended December 31, 2014 based in large measure
on our decision to maximize customer value by focusing marketing
spend on higher return channels and away from assisted selling
channels, and was flat compared to the three months ended
December 31, 2013. We monitor churn on a daily basis and use it as
an indicator of the level of customer satisfaction. Other companies may
calculate churn differently, and their churn data may not be directly
comparable to ours. Customers who have been with us for a year or
more tend to have a lower churn rate than customers who have not. In
addition, our customers who are residential international callers
generally churn at a lower rate than residential customers who are
domestic callers. Customers with service period requirements tend to
have a lower churn rate than customers without service period
requirements. Similar trends are seen between customers obtained
through retail sales, which generally do not include service period
requirements, and those obtained through non-retail channels, which
generally do include such service period requirements. In addition,
business customers generally churn at a lower rate than residential
customers. Our churn will fluctuate over time due to economic
conditions, competitive pressures, marketplace perception of our
services, and our ability to provide high quality customer care and
network quality and add future innovative products and services.
Average monthly operating revenues per line. Average
monthly revenue per line for a particular period is calculated by dividing
our total revenue for that period by the simple average number of
subscriber lines for the period, and dividing the result by the number of
months in the period. The simple average number of subscriber lines
for the period is the number of subscriber lines on the first day of the
period, plus the number of subscriber lines on the last day of the period,
divided by two. Our average monthly revenue per line increased slightly
to $28.89 for 2014 compared to $28.18 for 2013. This increase was due
primarily to price increase and higher USF offset by discontinuation of
charging for second extensions.
Average monthly cost of telephony services per line. Average
monthly cost of telephony services per line for a particular period is
calculated by dividing our cost of telephony services for that period by
the simple average number of subscriber lines for the period, and
dividing the result by the number of months in the period. We use the
average monthly cost of telephony services per line to evaluate how
effective we are at managing our costs of providing service. The
Company has reclassified certain personnel and related costs for
network operations and customer care that are attributable to revenue
generating activities from selling, general and administrative expense
to cost of telephony services for all periods presented. Our average
monthly cost of telephony services per line decreased to $7.71 for 2014
compared to $8.07 for 2013, due primarily to the decrease in
international usage costs.
Marketing cost per gross subscriber line addition. Marketing
cost per gross subscriber line addition is calculated by dividing our
marketing expense for a particular period by the number of gross
subscriber line additions during the period. Marketing expense does not
include the cost of certain customer acquisition activities, such as
rebates and promotions, which are accounted for as an offset to
revenues, or customer equipment subsidies, which are accounted for
as cost of goods sold. As a result, it does not represent the full cost to
us of obtaining a new customer. Our marketing cost per gross subscriber
line addition decreased to $341.77 for 2014 from $347.78 in 2013, due
to changes to our retail offers aimed at enhancing customer profitability
and reducing customer churn, which resulted in a softening of gross
subscriber line additions in our consumer business, partially offset by
our investment in VBS.
Employees. Employees represent the number of personnel
that are on our payroll and exclude temporary or outsourced labor.