Vonage 2014 Annual Report Download - page 37
Download and view the complete annual report
Please find page 37 of the 2014 Vonage annual report below. You can navigate through the pages in the report by either clicking on the pages listed below, or by using the keyword search tool below to find specific information within the annual report.-
 1
1 -
2
-
3
-
4
-
5
-
6
-
7
-
8
-
9
-
10
-
11
-
12
-
13
-
14
-
15
-
16
-
17
-
18
-
19
-
20
-
21
-
22
-
23
-
24
-
25
-
26
-
 27
27 -
 28
28 -
 29
29 -
 30
30 -
 31
31 -
 32
32 -
 33
33 -
 34
34 -
 35
35 -
 36
36 -
 37
37 -
 38
38 -
 39
39 -
 40
40 -
 41
41 -
 42
42 -
 43
43 -
 44
44 -
 45
45 -
 46
46 -
 47
47 -
48
-
49
-
50
-
51
-
52
-
53
-
54
-
55
-
56
-
57
-
58
-
59
-
60
-
61
-
62
-
63
-
64
-
65
-
66
-
67
-
68
-
69
-
70
-
71
-
72
-
73
-
74
-
75
-
76
-
77
-
78
-
79
-
80
-
81
-
82
-
83
-
84
-
85
-
86
-
87
-
88
-
89
-
90
-
91
-
92
-
93
-
94
-
95
-
96
-
97
-
98
-
99
-
100
 |
 |

Table of Contents
33 VONAGE ANNUAL REPORT 2014
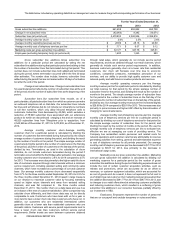
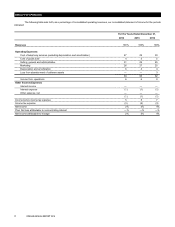
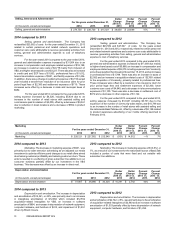
Selling, General and Administrative
For the years ended December 31,
Dollar
Change
2014 vs.
2013
Dollar
Change
2013 vs.
2012
Percent
Change
2014 vs.
2013
Percent
Change
2013 vs.
2012
(in thousands, except percentages) 2014 2013 2012
Selling, general and administrative $ 274,750 $ 238,720 $ 215,021 $ 36,030 $23,699 15% 11%
2014 compared to 2013
Selling, general and administrative. The Company has
reclassified $23,582 of costs for the year ended December 31, 2013
related to certain personnel and related network operations and
customer care costs attributable to revenue generating activities from
selling, general and administrative expense to cost of telephony
services.
For the year ended 2014 compared to the year ended 2013,
general and administrative expense increased by $31,504 due to an
increase in compensation and employee related expense of $18,198,
an increase in customer care costs of $2,778 mainly from inclusion of
VBS, and higher share based cost of $3,227. There was also an increase
in credit card and ECP fees of $1,063, professional fees of $1,612,
telecommunications expense of $551, and facility expense of $1,426.
In addition, there was a change in settlement expense of $3,150 as last
year included a benefit from resolution of an insurance claim for prior
period legal fees of $2,300 and settlement expenses of $715. These
increases were offset by a decrease in state and municipal taxes of
$682.
For the year ended 2014 compared to the year ended 2013,
selling expense increased by $4,526, including $5,434 due to an
increase in the number of retail stores with assisted selling and
commissions paid to retailers of $3,005, offset by a decrease of $3,361
due to reduction in kiosk locations and a decrease of $552 in product
marketing.
2013 compared to 2012
Selling, general and administrative. The Company has
reclassified $23,582 and $27,347 of costs for the years ended
December 31, 2013 and 2012, respectively, related to certain personnel
and related network operations and customer care costs attributable to
revenue generating activities from selling, general and administrative
expense to cost of telephony services.
For the year ended 2013 compared to the year ended 2012,
general and administrative expense increased by $11,058 due mainly
to higher share based cost of $5,868, an increase in compensation and
employee related expense of $9,273 including expense from Vocalocity
since the acquisition that closed on November 15, 2013, and an increase
in professional fees of $1,798. There was also an increase in taxes of
$2,082 and an increase in acquisition related costs of $2,768 related
to the acquisition of Vocalocity, primarily related to professional fees.
These increases were offset by a resolution of an insurance claim for
prior period legal fees and settlement expenses of $2,300, lower
customer care costs of $4,949, and a decrease in telecommunications
expenses of $1,100. There was also a decrease in settlement cost of
$972 and a decrease in other expense of $1,122.
For the year ended 2013 compared to the year ended 2012,
selling expense increased by $12,641 including $3,701 due to the
expansion of the number of community sales teams, and $10,749 due
to an increase in the number of retail stores with assisted selling and
the nationwide BasicTalk launch, offset by a decrease of $2,158 related
to product awareness advertising of our mobile offering launched in
February 2012.
Marketing
For the years ended December 31,
Dollar
Change
2014 vs.
2013
Dollar
Change
2013 vs.
2012
Percent
Change
2014 vs.
2013
Percent
Change
2013 vs.
2012
(in thousands, except percentages) 2014 2013 2012
Marketing $ 226,121 $ 227,052 $ 212,540 $ (931) $ 14,512 —% 7%
2014 compared to 2013
Marketing. The decrease in marketing expense of $931, was
primarily due to lower television advertising as we adjusted our media
investment to optimize efficiency and changes to our retail offers aimed
at enhancing customer profitability and reducing customer churn. These
actions resulted in a softening of gross subscriber line additions in our
consumer business partially offset by our investment in the VBS
business. This decrease was offset by an increase in direct mail.
2013 compared to 2012
Marketing. The increase in marketing expense of $14,512, or
7%, as a result of our investment for the nationwide launch of BasicTalk
included a portion of costs that were fixed and not variable with
subscriber line additions.
Depreciation and Amortization
For the years ended December 31, Dollar
Change
2014 vs.
2013
Dollar
Change
2013 vs.
2012
Percent
Change
2014 vs.
2013
Percent
Change
2013 vs.
2012
(in thousands, except percentages) 2014 2013 2012
Depreciation and amortization $51,407 $36,066 $33,324 $15,341 $2,742 43% 8%
2014 compared to 2013
Depreciation and amortization. The increase in depreciation
and amortization of $15,341, or 43%, was primarily due to an increase
in intangibles amortization of $12,084 which included $12,552
acquisition-related intangibles for VBS, an increase in software
amortization of $894, an increase in depreciation of network equipment,
computer hardware, and furniture of $412, and impairment of $1,951
driven by Brazil closure.
2013 compared to 2012
Depreciation and amortization. The increase in depreciation
and amortization of $2,742, or 8%, was primarily due to the amortization
of acquisition-related intangibles of $2,483 and an increase in software
amortization of $1,553 partially offset by lower depreciation of network
equipment, computer hardware, and furniture of $1,295.