United Healthcare 2014 Annual Report Download - page 82
Download and view the complete annual report
Please find page 82 of the 2014 United Healthcare annual report below. You can navigate through the pages in the report by either clicking on the pages listed below, or by using the keyword search tool below to find specific information within the annual report.-
 1
1 -
2
-
3
-
4
-
5
-
6
-
7
-
8
-
9
-
10
-
11
-
12
-
13
-
14
-
15
-
16
-
17
-
18
-
19
-
20
-
21
-
22
-
23
-
24
-
25
-
26
-
27
-
28
-
29
-
30
-
31
-
32
-
33
-
34
-
35
-
36
-
37
-
38
-
39
-
40
-
41
-
42
-
43
-
44
-
45
-
46
-
47
-
48
-
49
-
50
-
51
-
52
-
53
-
54
-
55
-
56
-
57
-
58
-
59
-
60
-
61
-
62
-
63
-
64
-
65
-
66
-
67
-
68
-
69
-
70
-
71
-
 72
72 -
 73
73 -
 74
74 -
 75
75 -
 76
76 -
 77
77 -
 78
78 -
 79
79 -
 80
80 -
 81
81 -
 82
82 -
 83
83 -
 84
84 -
 85
85 -
 86
86 -
 87
87 -
 88
88 -
 89
89 -
 90
90 -
 91
91 -
 92
92 -
93
-
94
-
95
-
96
-
97
-
98
-
99
-
100
-
101
-
102
-
103
-
104
-
105
-
106
-
107
-
108
-
109
-
110
-
111
-
112
-
113
-
114
-
115
-
116
-
117
-
118
-
119
-
120
 |
 |
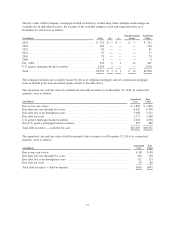
The following methods and assumptions were used to estimate the fair value and determine the fair value
hierarchy classification of each class of financial instrument included in the tables below:
Cash and Cash Equivalents. The carrying value of cash and cash equivalents approximates fair value as
maturities are less than three months. Fair values of cash equivalent instruments that do not trade on a regular
basis in active markets are classified as Level 2.
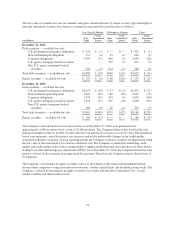
Debt and Equity Securities. Fair values of debt and equity securities are based on quoted market prices, where
available. The Company obtains one price for each security primarily from a third-party pricing service (pricing
service), which generally uses quoted or other observable inputs for the determination of fair value. The pricing
service normally derives the security prices through recently reported trades for identical or similar securities,
and, if necessary, makes adjustments through the reporting date based upon available observable market
information. For securities not actively traded, the pricing service may use quoted market prices of comparable
instruments or discounted cash flow analyses, incorporating inputs that are currently observable in the markets
for similar securities. Inputs that are often used in the valuation methodologies include, but are not limited to,
benchmark yields, credit spreads, default rates, prepayment speeds and nonbinding broker quotes. As the
Company is responsible for the determination of fair value, it performs quarterly analyses on the prices received
from the pricing service to determine whether the prices are reasonable estimates of fair value. Specifically, the
Company compares the prices received from the pricing service to prices reported by a secondary pricing source,
such as its custodian, its investment consultant and third-party investment advisors. Additionally, the Company
compares changes in the reported market values and returns to relevant market indices to test the reasonableness
of the reported prices. The Company’s internal price verification procedures and reviews of fair value
methodology documentation provided by independent pricing services have not historically resulted in
adjustment in the prices obtained from the pricing service.
Fair values of debt securities that do not trade on a regular basis in active markets but are priced using other
observable inputs are classified as Level 2.
Fair value estimates for Level 1 and Level 2 equity securities are based on quoted market prices for actively
traded equity securities and/or other market data for the same or comparable instruments and transactions in
establishing the prices.
The fair values of Level 3 investments in venture capital portfolios are estimated using a market valuation
technique that relies heavily on management assumptions and qualitative observations. Under the market
approach, the fair values of the Company’s various venture capital investments are computed using limited
quantitative and qualitative observations of activity for similar companies in the current market. The Company’s
market modeling utilizes, as applicable, transactions for comparable companies in similar industries that also
have similar revenue and growth characteristics and preferences in their capital structure. Key significant
unobservable inputs in the market technique include implied earnings before interest, taxes, depreciation and
amortization (EBITDA) multiples and revenue multiples. Additionally, the fair values of certain of the
Company’s venture capital securities are based on recent transactions in inactive markets for identical or similar
securities. Significant changes in any of these inputs could result in significantly lower or higher fair value
measurements.
Throughout the procedures discussed above in relation to the Company’s processes for validating third-party
pricing information, the Company validates the understanding of assumptions and inputs used in security pricing
and determines the proper classification in the hierarchy based on that understanding.
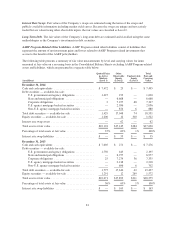
Other Assets. The fair values of the Company’s other assets are estimated and classified using the same
methodologies as the Company’s investments in debt securities.
AARP Program-Related Investments. AARP Program-related investments consist of debt securities and other
investments held to fund costs associated with the AARP Program and are priced and classified using the same
methodologies as the Company’s investments in debt and equity securities.
80