United Healthcare 2014 Annual Report Download - page 42
Download and view the complete annual report
Please find page 42 of the 2014 United Healthcare annual report below. You can navigate through the pages in the report by either clicking on the pages listed below, or by using the keyword search tool below to find specific information within the annual report.-
 1
1 -
2
-
3
-
4
-
5
-
6
-
7
-
8
-
9
-
10
-
11
-
12
-
13
-
14
-
15
-
16
-
17
-
18
-
19
-
20
-
21
-
22
-
23
-
24
-
25
-
26
-
27
-
28
-
29
-
30
-
31
-
 32
32 -
 33
33 -
 34
34 -
 35
35 -
 36
36 -
 37
37 -
 38
38 -
 39
39 -
 40
40 -
 41
41 -
 42
42 -
 43
43 -
 44
44 -
 45
45 -
 46
46 -
 47
47 -
 48
48 -
 49
49 -
 50
50 -
 51
51 -
 52
52 -
53
-
54
-
55
-
56
-
57
-
58
-
59
-
60
-
61
-
62
-
63
-
64
-
65
-
66
-
67
-
68
-
69
-
70
-
71
-
72
-
73
-
74
-
75
-
76
-
77
-
78
-
79
-
80
-
81
-
82
-
83
-
84
-
85
-
86
-
87
-
88
-
89
-
90
-
91
-
92
-
93
-
94
-
95
-
96
-
97
-
98
-
99
-
100
-
101
-
102
-
103
-
104
-
105
-
106
-
107
-
108
-
109
-
110
-
111
-
112
-
113
-
114
-
115
-
116
-
117
-
118
-
119
-
120
 |
 |

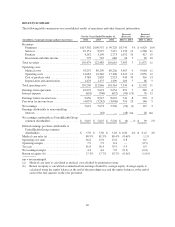
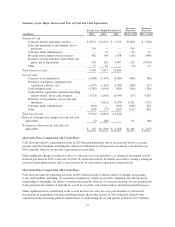
RESULTS SUMMARY
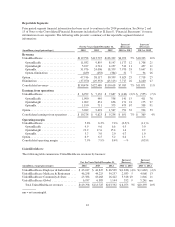
The following table summarizes our consolidated results of operations and other financial information:
(in millions, except percentages and per share data)
For the Years Ended December 31,
Increase/
(Decrease)
Increase/
(Decrease)
2014 2013 2012 2014 vs. 2013 2013 vs. 2012
Revenues:
Premiums ............................ $115,302 $109,557 $ 99,728 $5,745 5% $ 9,829 10%
Services .............................. 10,151 8,997 7,437 1,154 13 1,560 21
Products ............................. 4,242 3,190 2,773 1,052 33 417 15
Investment and other income ............. 779 745 680 34 5 65 10
Total revenues ........................... 130,474 122,489 110,618 7,985 7 11,871 11
Operating costs:
Medical costs ......................... 93,257 89,290 80,226 3,967 4 9,064 11
Operating costs ........................ 21,681 19,362 17,306 2,319 12 2,056 12
Cost of products sold ................... 3,784 2,839 2,523 945 33 316 13
Depreciation and amortization ............ 1,478 1,375 1,309 103 7 66 5
Total operating costs ...................... 120,200 112,866 101,364 7,334 6 11,502 11
Earnings from operations .................. 10,274 9,623 9,254 651 7 369 4
Interest expense ......................... (618) (708) (632) (90) (13) 76 12
Earnings before income taxes ............... 9,656 8,915 8,622 741 8 293 3
Provision for income taxes ................. (4,037) (3,242) (3,096) 795 25 146 5
Net earnings ............................ 5,619 5,673 5,526 (54) (1) 147 3
Earnings attributable to noncontrolling
interests .............................. — (48) — (48) nm 48 nm
Net earnings attributable to UnitedHealth Group
common shareholders ................... $ 5,619 $ 5,625 $ 5,526 $ (6) —% $ 99 2%
Diluted earnings per share attributable to
UnitedHealth Group common
shareholders .......................... $ 5.70 $ 5.50 $ 5.28 $ 0.20 4% $ 0.22 4%
Medical care ratio (a) ..................... 80.9% 81.5% 80.4% (0.6)% 1.1%
Operating cost ratio ...................... 16.6 15.8 15.6 0.8 0.2
Operating margin ........................ 7.9 7.9 8.4 — (0.5)
Tax rate ................................ 41.8 36.4 35.9 5.4 0.5
Net earnings margin ...................... 4.3 4.6 5.0 (0.3) (0.4)
Return on equity (b) ...................... 17.3% 17.7% 18.7% (0.4)% (1.0)%
nm = not meaningful
(a) Medical care ratio is calculated as medical costs divided by premium revenue.
(b) Return on equity is calculated as annualized net earnings divided by average equity. Average equity is
calculated using the equity balance at the end of the preceding year and the equity balances at the end of
each of the four quarters in the year presented.
40