United Healthcare 2014 Annual Report Download - page 43
Download and view the complete annual report
Please find page 43 of the 2014 United Healthcare annual report below. You can navigate through the pages in the report by either clicking on the pages listed below, or by using the keyword search tool below to find specific information within the annual report.-
 1
1 -
2
-
3
-
4
-
5
-
6
-
7
-
8
-
9
-
10
-
11
-
12
-
13
-
14
-
15
-
16
-
17
-
18
-
19
-
20
-
21
-
22
-
23
-
24
-
25
-
26
-
27
-
28
-
29
-
30
-
31
-
32
-
 33
33 -
 34
34 -
 35
35 -
 36
36 -
 37
37 -
 38
38 -
 39
39 -
 40
40 -
 41
41 -
 42
42 -
 43
43 -
 44
44 -
 45
45 -
 46
46 -
 47
47 -
 48
48 -
 49
49 -
 50
50 -
 51
51 -
 52
52 -
 53
53 -
54
-
55
-
56
-
57
-
58
-
59
-
60
-
61
-
62
-
63
-
64
-
65
-
66
-
67
-
68
-
69
-
70
-
71
-
72
-
73
-
74
-
75
-
76
-
77
-
78
-
79
-
80
-
81
-
82
-
83
-
84
-
85
-
86
-
87
-
88
-
89
-
90
-
91
-
92
-
93
-
94
-
95
-
96
-
97
-
98
-
99
-
100
-
101
-
102
-
103
-
104
-
105
-
106
-
107
-
108
-
109
-
110
-
111
-
112
-
113
-
114
-
115
-
116
-
117
-
118
-
119
-
120
 |
 |
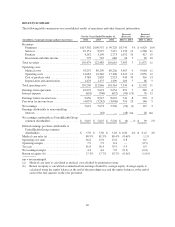
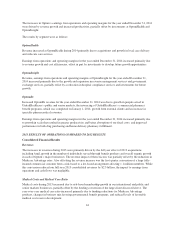
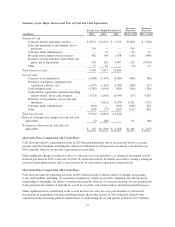
SELECTED OPERATING PERFORMANCE AND OTHER SIGNIFICANT ITEMS
The following represents a summary of select 2014 year-over-year operating comparisons to 2013 and other 2014
significant items.
• Consolidated revenues increased by 7%, Optum revenues grew 25% and UnitedHealthcare revenues
increased 5%.
• ACA Fees favorably affected our 2014 medical care ratio (110 bps), and unfavorably impacted our
operating cost ratio (120 bps) and effective income tax rate (510 bps).
• Earnings from operations increased by 7%, including an increase of 32% at Optum partially offset by a
decrease of 2% at UnitedHealthcare.
• Diluted earnings per share to UnitedHealth Group shareholders increased 4% to $5.70 and included the
negative year-over-year impact of approximately $1.00 per share in ACA Fees, ACA Medicare rate cuts and
other ACA impacts.
• As of December 31, 2014, there was $738 million of cash available for general corporate use and 2014 cash
flows from operations were $8.1 billion.
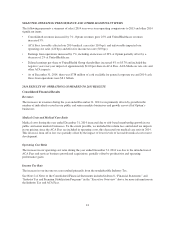
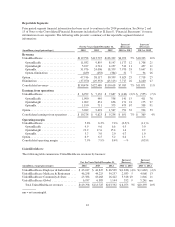
2014 RESULTS OF OPERATIONS COMPARED TO 2013 RESULTS
Consolidated Financial Results
Revenues
The increases in revenues during the year ended December 31, 2014 were primarily driven by growth in the
number of individuals served in our public and senior markets businesses and growth across all of Optum’s
businesses.
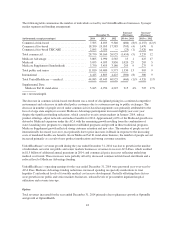
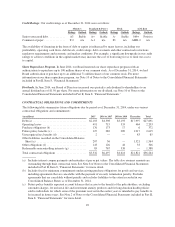
Medical Costs and Medical Care Ratio
Medical costs during the year ended December 31, 2014 increased due to risk-based membership growth in our
public and senior markets businesses. To the extent possible, we included the reform fees and related tax impacts
in our pricing; since the ACA Fees are included in operating costs, this decreased our medical care ratio in 2014.
This decrease from ACA fees was partially offset by the impact of lower levels of favorable medical cost reserve
development.
Operating Cost Ratio
The increase in our operating cost ratio during the year ended December 31, 2014 was due to the introduction of
ACA Fees and services business growth and acquisitions, partially offset by productivity and operating
performance gains.
Income Tax Rate
The increase in our income tax rate resulted primarily from the nondeductible Industry Tax.
See Note 2 of Notes to the Consolidated Financial Statements included in Item 8, “Financial Statements” and
“Industry Tax and Premium Stabilization Programs” in the “Executive Overview” above for more information on
the Industry Tax and ACA Fees.
41