Unilever 2010 Annual Report Download - page 5
Download and view the complete annual report
Please find page 5 of the 2010 Unilever annual report below. You can navigate through the pages in the report by either clicking on the pages listed below, or by using the keyword search tool below to find specific information within the annual report.-
 1
1 -
 2
2 -
 3
3 -
 4
4 -
 5
5 -
 6
6 -
 7
7 -
 8
8 -
 9
9 -
 10
10 -
 11
11 -
 12
12 -
 13
13 -
 14
14 -
 15
15 -
 16
16 -
17
-
18
-
19
-
20
-
21
-
22
-
23
-
24
-
25
-
26
-
27
-
28
-
29
-
30
-
31
-
32
-
33
-
34
-
35
-
36
-
37
-
38
-
39
-
40
-
41
-
42
-
43
-
44
-
45
-
46
-
47
-
48
-
49
-
50
-
51
-
52
-
53
-
54
-
55
-
56
-
57
-
58
-
59
-
60
-
61
-
62
-
63
-
64
-
65
-
66
-
67
-
68
-
69
-
70
-
71
-
72
-
73
-
74
-
75
-
76
-
77
-
78
-
79
-
80
-
81
-
82
-
83
-
84
-
85
-
86
-
87
-
88
-
89
-
90
-
91
-
92
-
93
-
94
-
95
-
96
-
97
-
98
-
99
-
100
-
101
-
102
-
103
-
104
-
105
-
106
-
107
-
108
-
109
-
110
-
111
-
112
-
113
-
114
-
115
-
116
-
117
-
118
-
119
-
120
-
121
-
122
-
123
-
124
-
125
-
126
-
127
-
128
-
129
-
130
-
131
-
132
-
133
-
134
-
135
-
136
-
137
-
138
-
139
-
140
-
141
-
142
-
143
-
144
-
145
-
146
-
147
-
148
-
149
 |
 |

Report of the Directors About Unilever
2 Unilever Annual Report and Accounts 2010
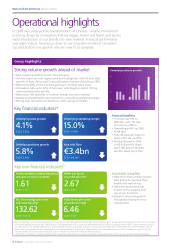
Operational highlights
In 2010 we continued the transformation of Unilever. Volume momentum
isstrong, driven by innovations that are bigger, better and faster, and by the
rapid introduction of our brands into new markets. Financial performance
wasagain robust, moving us closer to our long-term model of consistent
topand bottom line growth. We are now fit to compete.
Group highlights
Strong volume growth ahead of market
• Best volume growth for more than 30 years.
• Volume share up in all regions and most categories, with double digit
growth in Asia, Africa and Central & Eastern Europe (Asia Africa CEE).
• More than 60% of the business gaining or holding value share.
• Innovation rate up to 33% of turnover, with bigger projects hitting
moremarkets more quickly.
• More than 100 launches of Unilever brands into new markets.
• Steady and sustainable improvement in underlying operating margin.
• Strong cash flow and cost discipline, with savings of €1.4bn.
Underlying volume growth
Key financial indicators*
Underlying sales growth
4.1%
2009: 3.5%
1
Underlying volume growth
5.8%
2009: 2.3%
Underlying operating margin
15.0%
2009: 14.8%
Free cash flow
€3.4bn
2009: €4.1bn
Key non-financial indicators◊
Total recordable accident frequency
rate (per 1m hours worked)
.61
2009: 1.91
C02 from energy per tonne
ofproduction (kg)
132.62
2009: 142.16
Water per tonne
ofproduction (m3)
2.67
2009: 2.81
Total waste per tonne
of production (kg)
6.46
2009: 6.52
Financial headlines
• Turnover up 11% to
€44.3bn, with 7% due
tocurrency effects.
• Operating profit up 26%
to €6.3bn.
• Fully diluted earnings per
share of €1.46, up 25%.
• Dividends paid in 2010
of€0.819 per NV share
(up 5.1%) and of £0.7053
per PLC share (up 9.5%).
Sustainable Living Plan
• Help more than a billion people
take action toimprove their
health andwell-being.
• Halve the environmental
impactof the making and
useofour products.
• Enhance the livelihoods of
thousands of people in our
supply chain.
Basis of reporting: our accounting policies are in accordance with International Financial Reporting Standards (IFRS), as adopted by the European Union (EU), and based
on UnitedKingdom and Dutch law. They are also in accordance with IFRS as issued by the International Accounting Standards Board (IASB). Certain measures used in
ourreporting are not defined under IFRS or other generally accepted accounting principles. For further information about these measures, and the reasons why we
believethey are important for an understanding of the performance of the business, please refer to our commentary on non-GAAP measures on pages 31 and 32.
* Further details of our key financial indicators can be found in our financial review starting on page 22.
◊ 2010 data is preliminary. It will be independently assured and reported in our online Sustainable Development Report 2010 at www.unilever.com/sustainability.