Unilever 2010 Annual Report Download - page 11
Download and view the complete annual report
Please find page 11 of the 2010 Unilever annual report below. You can navigate through the pages in the report by either clicking on the pages listed below, or by using the keyword search tool below to find specific information within the annual report.-
 1
1 -
 2
2 -
 3
3 -
 4
4 -
 5
5 -
 6
6 -
 7
7 -
 8
8 -
 9
9 -
 10
10 -
 11
11 -
 12
12 -
 13
13 -
 14
14 -
 15
15 -
 16
16 -
 17
17 -
 18
18 -
 19
19 -
 20
20 -
 21
21 -
 22
22 -
23
-
24
-
25
-
26
-
27
-
28
-
29
-
30
-
31
-
32
-
33
-
34
-
35
-
36
-
37
-
38
-
39
-
40
-
41
-
42
-
43
-
44
-
45
-
46
-
47
-
48
-
49
-
50
-
51
-
52
-
53
-
54
-
55
-
56
-
57
-
58
-
59
-
60
-
61
-
62
-
63
-
64
-
65
-
66
-
67
-
68
-
69
-
70
-
71
-
72
-
73
-
74
-
75
-
76
-
77
-
78
-
79
-
80
-
81
-
82
-
83
-
84
-
85
-
86
-
87
-
88
-
89
-
90
-
91
-
92
-
93
-
94
-
95
-
96
-
97
-
98
-
99
-
100
-
101
-
102
-
103
-
104
-
105
-
106
-
107
-
108
-
109
-
110
-
111
-
112
-
113
-
114
-
115
-
116
-
117
-
118
-
119
-
120
-
121
-
122
-
123
-
124
-
125
-
126
-
127
-
128
-
129
-
130
-
131
-
132
-
133
-
134
-
135
-
136
-
137
-
138
-
139
-
140
-
141
-
142
-
143
-
144
-
145
-
146
-
147
-
148
-
149
 |
 |

Report of the Directors About Unilever
8 Unilever Annual Report and Accounts 2010
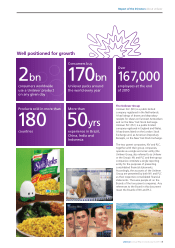
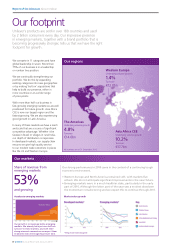
Our footprint
Unilever’s products are sold in over 180 countries and used
by 2billion consumers every day. Our impressive presence
in emerging markets, together with a brand portfolio that is
becomingprogressively stronger, tells us thatwe have the right
footprint for growth.
We compete in 11 categories and have
global leadership inseven. More than
75% of our business is in a leadership
ornumber two position.
We are continually strengthening our
portfolio. We do this by expanding
existing categories into new geographies
orby making ‘bolt on’ acquisitions that
helpto build our presence, either in
morecountries or at a wider range
ofprice points.
With more than half our business in
fast-growing emerging markets we are well
positioned for future growth. Asia Africa
CEE isnow our largest region and the
fastest growing. We are also experiencing
good growth in Latin America.
In many of these markets we have a reach
and scale that are a source of significant
competitive advantage. Whether it be
favelas in Brazil or villages in rural India,
our depth of distribution is impressive.
Indeveloped markets, our supply chain
ensures we give high quality service
toourmodern trade customers in places
likethe US and Western Europe. All numbers are at 31 December 2010.
Asia Africa CEE
Underlying volume growth
10.2%
Turnover
€17.7bn
The Americas
Underlying volume growth
4.8%
Turnover
€14.6bn
Western Europe
Underlying volume growth
1.4%
Turnover
€12.0bn
Our regions
Market value growthAccelerate emerging markets
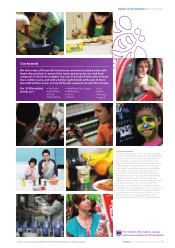
Our markets
Share of revenue from
5
eme
3
rging
%
markets
and growing
Our growth is increasingly led by emerging
markets. We already have just over half our
turnover in these markets, and with their
strong economic momentum we expect them
to become even more significant over time.
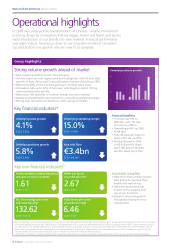
Our strong performance in 2010 came in the context of a continuing tough
economic environment.
• Western Europe and North America remained soft, with markets flat
at best. We do not anticipate significant improvements in the near future.
• Emerging markets were in a much healthier state, particularly in the early
part of 2010. Although the latter part of the year saw a modest slowdown
the momentum remains strong and we expect this to continue through 2011.