Unilever 2003 Annual Report Download - page 9
Download and view the complete annual report
Please find page 9 of the 2003 Unilever annual report below. You can navigate through the pages in the report by either clicking on the pages listed below, or by using the keyword search tool below to find specific information within the annual report.-
 1
1 -
 2
2 -
 3
3 -
 4
4 -
 5
5 -
 6
6 -
 7
7 -
 8
8 -
 9
9 -
 10
10 -
 11
11 -
 12
12 -
 13
13 -
 14
14 -
 15
15 -
 16
16 -
 17
17 -
 18
18 -
 19
19 -
 20
20 -
21
-
22
-
23
-
24
-
25
-
26
-
27
-
28
-
29
-
30
-
31
-
32
-
33
-
34
-
35
-
36
-
37
-
38
-
39
-
40
-
41
-
42
-
43
-
44
-
45
-
46
-
47
-
48
-
49
-
50
-
51
-
52
-
53
-
54
-
55
-
56
-
57
-
58
-
59
-
60
-
61
-
62
-
63
-
64
-
65
-
66
-
67
-
68
-
69
-
70
-
71
-
72
-
73
-
74
-
75
-
76
-
77
-
78
-
79
-
80
-
81
-
82
-
83
-
84
-
85
-
86
-
87
-
88
-
89
-
90
-
91
-
92
-
93
-
94
-
95
-
96
-
97
-
98
-
99
-
100
-
101
-
102
-
103
-
104
-
105
-
106
-
107
-
108
-
109
-
110
-
111
-
112
-
113
-
114
-
115
-
116
-
117
-
118
-
119
-
120
-
121
-
122
-
123
-
124
-
125
-
126
-
127
-
128
-
129
-
130
-
131
-
132
-
133
-
134
-
135
-
136
-
137
-
138
-
139
-
140
-
141
-
142
-
143
-
144
-
145
-
146
-
147
-
148
-
149
-
150
-
151
-
152
-
153
-
154
-
155
-
156
-
157
-
158
-
159
-
160
-
161
-
162
-
163
-
164
-
165
-
166
-
167
-
168
-
169
 |
 |

06 Unilever Annual Report & Accounts and Form 20-F 2003
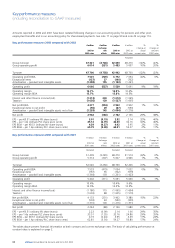
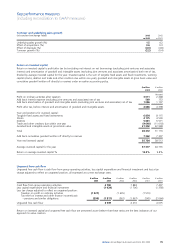
Financial highlights
at current rates of exchange
Combined earnings per share and dividends per share(a)
Ordinary €0.51 shares of NV(b) Ordinary 1.4p shares of PLC
2003 2002 2001 2003 2002 2001
Basic earnings per share (euros) €2.82 €2.14 €1.66 €0.42 €0.32 €0.25
Effect of exceptional items net of tax €0.07 €0.56 €0.34 €0.01 €0.08 €0.05
Effect of amortisation of goodwill and intangible assets net of tax €1.13 €1.25 €1.39 €0.17 €0.19 €0.21
Basic earnings per share BEIA (euros) €4.02 €3.95 €3.39 €0.60 €0.59 €0.51
Basic earnings per share (pence) 29.26p 20.19p 15.46p
Effect of exceptional items net of tax 0.73p 5.31p 3.13p
Effect of amortisation of goodwill and intangible assets net of tax 11.70p 11.72p 13.01p
Basic earnings per share BEIA (pence) 41.69p 37.22p 31.60p
Diluted earnings per share (euros) €2.74 €2.08 €1.61 €0.41 €0.31 €0.24
Diluted earnings per share (pence) 28.40p 19.59p 15.05p
Dividend per share (euros) €1.74 €1.70 €1.56
Dividend per share (pence) 18.08p 16.04p 14.54p
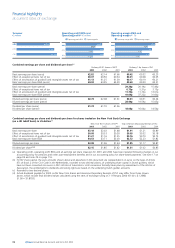
Combined earnings per share and dividends per share for shares traded on the New York Stock Exchange
(on a UK GAAP basis) in US dollars(a)
New York €0.51 shares of NV(b) 5.6p American Depositary Receipts of PLC
2003 2002 2001 2003 2002 2001
Basic earnings per share $3.18 $2.02 $1.48 $1.91 $1.21 $0.89
Effect of exceptional items net of tax $0.08 $0.53 $0.30 $0.05 $0.32 $0.18
Effect of amortisation of goodwill and intangible assets net of tax $1.27 $1.16 $1.25 $0.76 $0.70 $0.75
Basic earnings per share BEIA $4.53 $3.71 $3.03 $2.72 $2.23 $1.82
Diluted earnings per share $3.08 $1.96 $1.44 $1.85 $1.17 $0.87
Dividend per share(c)(d) $2.15 $1.85 $1.42 $1.31 $1.02 $0.85
(a) Operating profit, operating profit BEIA and all earnings per share measures for 2001 and 2002 have been restated following changes in our
accounting policy for pensions and other post-employment benefits and in our accounting policy for share-based payments. See note 17 on
page 99 and note 29 on page 116.
(b) For NV share capital, the euro amounts shown above and elsewhere in this document are representations in euros on the basis of Article
67c of Book 2 of the Civil Code in the Netherlands, rounded to two decimal places, of underlying share capital in Dutch guilders, which
have not been converted into euros in NV’s Articles of Association. Until conversion formally takes place by amendment of the Articles of
Association, the entitlements to dividends and voting rights are based on the underlying Dutch guilder amounts.
(c) Rounded to two decimal places.
(d) Actual dividends payable for 2003 on NV New York shares and American Depositary Receipts of PLC may differ from those shown
above, which include final dividend values calculated using the rates of exchange ruling on 11 February 2004 (€1.00 = $1.2668,
£1.00 = $1.8703).
Operating profit BEIA Operating profit Operating margin BEIA Operating margin
Turnover
€ million
2003 42 942 6 772
5 529
7 054
5 091
7 032
5 030
2002 48 760
2001 52 206
Operating profit BEIA and
Operating profit(a) € million
2003
2002
2001
15.8
12.9
14.5
10.4
13.5
9.6
2003
2002
2001
Operating margin BEIA and
Operating margin(a) %