Unilever 2003 Annual Report Download - page 19
Download and view the complete annual report
Please find page 19 of the 2003 Unilever annual report below. You can navigate through the pages in the report by either clicking on the pages listed below, or by using the keyword search tool below to find specific information within the annual report.-
 1
1 -
2
-
3
-
4
-
5
-
6
-
7
-
8
-
 9
9 -
 10
10 -
 11
11 -
 12
12 -
 13
13 -
 14
14 -
 15
15 -
 16
16 -
 17
17 -
 18
18 -
 19
19 -
 20
20 -
 21
21 -
 22
22 -
 23
23 -
 24
24 -
 25
25 -
 26
26 -
 27
27 -
 28
28 -
 29
29 -
30
-
31
-
32
-
33
-
34
-
35
-
36
-
37
-
38
-
39
-
40
-
41
-
42
-
43
-
44
-
45
-
46
-
47
-
48
-
49
-
50
-
51
-
52
-
53
-
54
-
55
-
56
-
57
-
58
-
59
-
60
-
61
-
62
-
63
-
64
-
65
-
66
-
67
-
68
-
69
-
70
-
71
-
72
-
73
-
74
-
75
-
76
-
77
-
78
-
79
-
80
-
81
-
82
-
83
-
84
-
85
-
86
-
87
-
88
-
89
-
90
-
91
-
92
-
93
-
94
-
95
-
96
-
97
-
98
-
99
-
100
-
101
-
102
-
103
-
104
-
105
-
106
-
107
-
108
-
109
-
110
-
111
-
112
-
113
-
114
-
115
-
116
-
117
-
118
-
119
-
120
-
121
-
122
-
123
-
124
-
125
-
126
-
127
-
128
-
129
-
130
-
131
-
132
-
133
-
134
-
135
-
136
-
137
-
138
-
139
-
140
-
141
-
142
-
143
-
144
-
145
-
146
-
147
-
148
-
149
-
150
-
151
-
152
-
153
-
154
-
155
-
156
-
157
-
158
-
159
-
160
-
161
-
162
-
163
-
164
-
165
-
166
-
167
-
168
-
169
 |
 |

16 Unilever Annual Report & Accounts and Form 20-F 2003
Financial review
invoiced based on our knowledge of customer, consumer and
promotional activity.
Goodwill, intangible and tangible fixed assets
Impairment reviews in respect of goodwill and intangible fixed
assets are performed at least annually. More regular reviews, and
impairment reviews in respect of tangible fixed assets, are
performed if events indicate that this is necessary. Examples of
such triggering events would include a significant planned
restructuring, a major change in market conditions or technology,
expectations of future operating losses or negative cash flows.
Impairment reviews are performed following the guidance in UK
Financial Reporting Standard 11, United States SFAS 142 and
SFAS 144. Such reviews are performed by comparing the carrying
value of the asset concerned to a valuation derived from
discounted future cash flows. Significant assumptions, such as
long-term growth rates and discount rates, are made in preparing
these forecast cash flows; although these are believed to be
appropriate, changes in these assumptions could change the
outcomes of the impairment reviews.
The most significant balances of goodwill and intangible assets
are those arising from the purchases of Bestfoods and Slim•Fast.
We have reviewed the balances related to the Bestfoods
acquisition (€14.8 billion), by considering actual and planned
growth rates of Bestfoods brands and the synergy savings arising
from its integration. No impairment loss has been identified.
Our review of the balances related to Slim•Fast (€1.4 billion)
is based upon the assumption that the plans for the business,
referred to in the Operating Review on pages 23 and 36, achieve
a stabilisation of revenues during 2004 and a return to growth
thereafter. We conclude, on this basis, that there is no
impairment but the position will be monitored.
Deferred tax
Full provision is made for deferred taxation, as required under UK
Financial Reporting Standard 19, at the rates of tax prevailing at
the year-end unless future rates have been enacted, as detailed
on page 75. Deferred tax assets are regularly reviewed for
recoverability, and a valuation allowance is established to the
extent that recoverability is not considered likely.
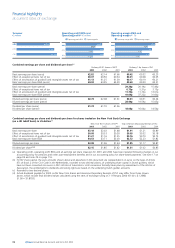
Results – 2003 compared with 2002
2003 6 772
2002 7 054
2001 7 032
Operating profit BEIA
€ million
2003 5 529
2002 5 091
2001 5 030
Operating profit
€ million
2003 42 942
2002 48 760
2001 52 206
Turnover
€ million
As noted in the preceding section, with effect from 1 January
2003 we have adopted FRS 17 in respect of pensions accounting
and have implemented a new accounting policy for share options.
Amounts for prior years have been restated in the financial
statements and in the following commentary.
Turnover fell by 12% to €42 942 million. This decrease was
primarily due to a 10% strengthening of the average exchange
rate for the euro against the basket of Unilever currencies. At
constant rates of exchange, underlying sales grew by 1.5% in the
year, but the net effect of this and our continued programme of
disposals under Path to Growth, partly offset by the increase in
our holding in Unilever Bestfoods businesses across Asia, was a
2% reduction in turnover. The main disposal impact came from
the sale of DiverseyLever, Mazola and Loders Croklaan.
Group turnover was €42 693 million (2002: €48 270 million). Our
share of turnover from joint ventures continued to fall in 2003 to
€249 million (2002: €490 million) as a result of increases in our
holding in former Bestfoods joint ventures in Asia and South
Africa and their consequent inclusion as subsidiaries.
Operating profit was up 9% at €5 529 million for the year (2002:
€5 091 million) and the operating margin increased to 12.9%
(2002: 10.4%), with a significant contribution from lower net
exceptional charges. Operating profit BEIA was 4% lower at
€6 772 million, compared with €7 054 million in 2002. Operating
margin BEIA improved strongly from 14.5% in 2002 to 15.8%
despite an increase in brand investment; this was achieved
through improved gross margins and lower overheads as a result
of the Path to Growth savings programmes. These improvements
were more than offset by the strengthening of the euro. Group
operating profit BEIA was €6 719 million (2002: €6 959 million).
Amortisation of goodwill and intangible assets was €1 143 million
compared with €1 261 million in 2002. The decrease is mainly
due to the strengthening of the euro in 2003.
Net exceptional charges included in operating profit for the
year were €100 million (2002: €702 million), which included
€470 million of restructuring investment costs and a net credit
for the profit and losses on disposals of €370 million. The
restructuring costs primarily relate to Path to Growth initiatives,
and the continued integration of Bestfoods. Associated costs of
€121 million were included within operating profit BEIA for the
year (2002: €191 million).
Group operating profit increased by 10% to €5 483 million.
An overview of operating performance by region and product
category is included in the regional and category texts on pages
21 to 30 and 31 to 44 respectively.
Net interest cost, excluding pensions interest, fell to €847 million
from €1 173 million in 2002 as a result of the lower overall level
of net debt and the positive impact of currency movement on the
cost of our US dollar-based debt. The net interest cover for the
year was 6.7 times compared with 4.5 times in 2002. The net
interest cover on the basis of EBITDA was 9.5 times (2002:
7.0 times). The pension net interest charge for the year was
€166 million compared with a net interest credit of €108 million
in 2002. This change reflected a lower expected return on
pension assets for 2003 as a result of lower asset values following
the weak stock market performance in 2002.