Unilever 2003 Annual Report Download - page 8
Download and view the complete annual report
Please find page 8 of the 2003 Unilever annual report below. You can navigate through the pages in the report by either clicking on the pages listed below, or by using the keyword search tool below to find specific information within the annual report.-
 1
1 -
 2
2 -
 3
3 -
 4
4 -
 5
5 -
 6
6 -
 7
7 -
 8
8 -
 9
9 -
 10
10 -
 11
11 -
 12
12 -
 13
13 -
 14
14 -
 15
15 -
 16
16 -
 17
17 -
 18
18 -
 19
19 -
20
-
21
-
22
-
23
-
24
-
25
-
26
-
27
-
28
-
29
-
30
-
31
-
32
-
33
-
34
-
35
-
36
-
37
-
38
-
39
-
40
-
41
-
42
-
43
-
44
-
45
-
46
-
47
-
48
-
49
-
50
-
51
-
52
-
53
-
54
-
55
-
56
-
57
-
58
-
59
-
60
-
61
-
62
-
63
-
64
-
65
-
66
-
67
-
68
-
69
-
70
-
71
-
72
-
73
-
74
-
75
-
76
-
77
-
78
-
79
-
80
-
81
-
82
-
83
-
84
-
85
-
86
-
87
-
88
-
89
-
90
-
91
-
92
-
93
-
94
-
95
-
96
-
97
-
98
-
99
-
100
-
101
-
102
-
103
-
104
-
105
-
106
-
107
-
108
-
109
-
110
-
111
-
112
-
113
-
114
-
115
-
116
-
117
-
118
-
119
-
120
-
121
-
122
-
123
-
124
-
125
-
126
-
127
-
128
-
129
-
130
-
131
-
132
-
133
-
134
-
135
-
136
-
137
-
138
-
139
-
140
-
141
-
142
-
143
-
144
-
145
-
146
-
147
-
148
-
149
-
150
-
151
-
152
-
153
-
154
-
155
-
156
-
157
-
158
-
159
-
160
-
161
-
162
-
163
-
164
-
165
-
166
-
167
-
168
-
169
 |
 |

Unilever Annual Report & Accounts and Form 20-F 2003 05
Key performance measures
(including reconciliation to GAAP measures)
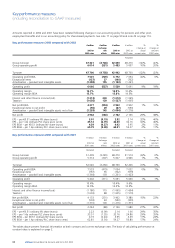
Turnover and underlying sales growth
(at constant exchange rates) 2003 2002
vs 2002 vs 2001
Underlying sales growth (%) 1.5 4.2
Effect of acquisitions (%) 0.6 0.3
Effect of disposals (%) (4.3) (4.8)
Turnover growth (%) (2.2) (0.4)
Return on invested capital
Return on invested capital is profit after tax but excluding net interest on net borrowings (excluding joint ventures and associates
interest) and amortisation of goodwill and intangible assets (excluding joint ventures and associates amortisation) both net of tax,
divided by average invested capital for the year. Invested capital is the sum of tangible fixed assets and fixed investments, working
capital (stocks, debtors and trade and other creditors due within one year), goodwill and intangible assets at gross book value and
cumulative goodwill written off directly to reserves under an earlier accounting policy.
€ million € million
2003 2002
Restated
Profit on ordinary activities after taxation 3 011 2 448
Add back interest expense (excluding joint ventures and associates) net of tax 569 753
Add back amortisation of goodwill and intangible assets (excluding joint ventures and associates) net of tax 1 086 1 197
Profit after tax, before interest and amortisation of goodwill and intangible assets 4 666 4 398
Year end positions for invested capital:
Tangible fixed assets and fixed investments 6 854 8 115
Stocks 4 175 4 500
Debtors 5 881 6 571
Trade and other creditors due within one year (9 640) (11 018)
Goodwill and intangible assets at gross book value 21 202 22 948
Total 28 472 31 116
Add back cumulative goodwill written off directly to reserves 7 262 7 397
Year end invested capital 35 734 38 513
Average invested capital for the year 37 377 44 735
Return on average invested capital % 12.5% 9.8%
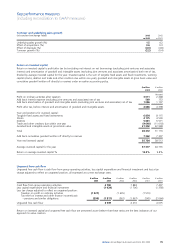
Ungeared free cash flow
Ungeared free cash flow is cash flow from group operating activities, less capital expenditure and financial investment and less a tax
charge adjusted to reflect an ungeared position, all expressed at current exchange rates.
€ million € million € million € million € million € million
2003 2003 2002 2002 2001 2001
Cash flow from group operating activities 6 780 7 883 7 497
Less capital expenditure and financial investment (1 024) (1 706) (1 358)
Less tax charge adjusted to reflect an ungeared position:
Taxation on profit on ordinary activities (1 527) (1 605) (1 519)
Tax relief on interest and other finance income/(cost)
– pensions and similar obligations (290) (1 817) (362) (1 967) (545) (2 064)
Ungeared free cash flow 3 939 4 210 4 075
Return on invested capital and ungeared free cash flow are presented as we believe that these ratios are the best indicators of our
approach to value creation.