Unilever 2003 Annual Report Download - page 6
Download and view the complete annual report
Please find page 6 of the 2003 Unilever annual report below. You can navigate through the pages in the report by either clicking on the pages listed below, or by using the keyword search tool below to find specific information within the annual report.-
 1
1 -
 2
2 -
 3
3 -
 4
4 -
 5
5 -
 6
6 -
 7
7 -
 8
8 -
 9
9 -
 10
10 -
 11
11 -
 12
12 -
 13
13 -
 14
14 -
 15
15 -
 16
16 -
 17
17 -
18
-
19
-
20
-
21
-
22
-
23
-
24
-
25
-
26
-
27
-
28
-
29
-
30
-
31
-
32
-
33
-
34
-
35
-
36
-
37
-
38
-
39
-
40
-
41
-
42
-
43
-
44
-
45
-
46
-
47
-
48
-
49
-
50
-
51
-
52
-
53
-
54
-
55
-
56
-
57
-
58
-
59
-
60
-
61
-
62
-
63
-
64
-
65
-
66
-
67
-
68
-
69
-
70
-
71
-
72
-
73
-
74
-
75
-
76
-
77
-
78
-
79
-
80
-
81
-
82
-
83
-
84
-
85
-
86
-
87
-
88
-
89
-
90
-
91
-
92
-
93
-
94
-
95
-
96
-
97
-
98
-
99
-
100
-
101
-
102
-
103
-
104
-
105
-
106
-
107
-
108
-
109
-
110
-
111
-
112
-
113
-
114
-
115
-
116
-
117
-
118
-
119
-
120
-
121
-
122
-
123
-
124
-
125
-
126
-
127
-
128
-
129
-
130
-
131
-
132
-
133
-
134
-
135
-
136
-
137
-
138
-
139
-
140
-
141
-
142
-
143
-
144
-
145
-
146
-
147
-
148
-
149
-
150
-
151
-
152
-
153
-
154
-
155
-
156
-
157
-
158
-
159
-
160
-
161
-
162
-
163
-
164
-
165
-
166
-
167
-
168
-
169
 |
 |
Unilever Annual Report & Accounts and Form 20-F 2003 03
General information
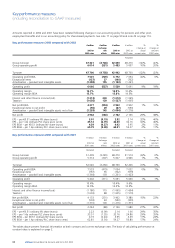
In our reporting, Turnover comprises Group turnover plus the
Group share of turnover of joint ventures, net of the Group share
of any sales to the joint ventures already included in the Group
figures, but does not include our share of the turnover of
associates. Operating profit comprises Group operating profit
plus our share of operating profit of joint ventures. This measure
does not include our share of the operating profit of associates.
References to turnover growth include the effects of acquisitions
and disposals. Underlying sales growth reflects the change in
revenue excluding the effects of acquisitions and disposals. We
believe this measure provides valuable additional information on
the underlying performance of the business.
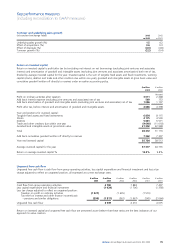
Leading brand growth is a subset of underlying sales growth
and measures the change in revenue arising from our leading
brands. Leading brand growth is a key metric used to measure
the progress of the Path to Growth programme.
Return on invested capital is profit after tax but excluding
net interest on net borrowings (excluding joint ventures and
associates interest) and amortisation of goodwill and intangible
assets (excluding joint ventures and associates amortisation)
both net of tax, divided by average invested capital for the year.
Invested capital is the sum of tangible fixed assets and fixed
investments, working capital (stocks, debtors and trade and other
creditors due within one year), goodwill and intangible assets at
gross book value and cumulative goodwill written off directly to
reserves under an earlier accounting policy.
Ungeared free cash flow is defined as cash flow from group
operating activities, less capital expenditure and financial
investment and less a tax charge adjusted to reflect an
ungeared position.
Tables reconciling certain of these measures to the statutory
measures included in the Financial Statements are shown on page
4 and 5 and throughout the section entitled ‘Operating review’
on pages 21 to 44.
€is used in this report to denote amounts in euros.
£and pare used in this report to denote amounts in pounds
sterling and pence respectively.
Fl. is used in this report to denote amounts in Dutch guilders.
$is used in this report to denote amounts in United States
dollars, except where specifically stated otherwise.
The brand names shown in italics in this report are trademarks
owned by or licensed to companies within the Unilever Group.
Cautionary statement
This Annual Report & Accounts and Form 20-F may contain
‘forward-looking statements’ within the meaning of the US
Private Securities Litigation Reform Act of 1995. Words such
as ‘expects’, ‘anticipates’, ‘intends’ and other similar expressions
of future performance or results are intended to identify such
forward-looking statements. These forward-looking statements
are based upon current expectations and assumptions regarding
anticipated developments and other factors affecting the Group.
Because of the risks and uncertainties that always exist in any
operating environment or business, the Group cannot give any
assurance that the expectations expressed in these statements
will prove correct. Actual results may differ materially from those
included in these statements due to a variety of factors, including,
among others, competitive pricing and activities, consumption
levels, costs, the ability to maintain and manage key customer
relationships and supply chain sources, currency values, interest
rates, the ability to integrate acquisitions and complete planned
divestitures, physical risks, environmental risks, the ability to
manage regulatory, tax and legal matters and resolve pending
matters within current estimates, legislative, fiscal and regulatory
developments, and political, economic and social conditions in
the geographic markets where the Group operates. The Group
undertakes no obligation to publicly update any forward-looking
statement, whether as a result of new information, future events
or otherwise, and you are cautioned not to place undue reliance
on these forward-looking statements.
Risks and uncertainties that could cause actual results to vary
from those described in our forward-looking statements include
those given under the sections entitled ‘About Unilever‘ on pages
9 to 14, ‘Financial review‘ on pages 15 to 20, ‘Operating review‘
on pages 21 to 44, and ‘Risk management‘ on pages 45 and 46,
to which you should refer.