Unilever 2003 Annual Report Download - page 7
Download and view the complete annual report
Please find page 7 of the 2003 Unilever annual report below. You can navigate through the pages in the report by either clicking on the pages listed below, or by using the keyword search tool below to find specific information within the annual report.-
 1
1 -
 2
2 -
 3
3 -
 4
4 -
 5
5 -
 6
6 -
 7
7 -
 8
8 -
 9
9 -
 10
10 -
 11
11 -
 12
12 -
 13
13 -
 14
14 -
 15
15 -
 16
16 -
 17
17 -
 18
18 -
19
-
20
-
21
-
22
-
23
-
24
-
25
-
26
-
27
-
28
-
29
-
30
-
31
-
32
-
33
-
34
-
35
-
36
-
37
-
38
-
39
-
40
-
41
-
42
-
43
-
44
-
45
-
46
-
47
-
48
-
49
-
50
-
51
-
52
-
53
-
54
-
55
-
56
-
57
-
58
-
59
-
60
-
61
-
62
-
63
-
64
-
65
-
66
-
67
-
68
-
69
-
70
-
71
-
72
-
73
-
74
-
75
-
76
-
77
-
78
-
79
-
80
-
81
-
82
-
83
-
84
-
85
-
86
-
87
-
88
-
89
-
90
-
91
-
92
-
93
-
94
-
95
-
96
-
97
-
98
-
99
-
100
-
101
-
102
-
103
-
104
-
105
-
106
-
107
-
108
-
109
-
110
-
111
-
112
-
113
-
114
-
115
-
116
-
117
-
118
-
119
-
120
-
121
-
122
-
123
-
124
-
125
-
126
-
127
-
128
-
129
-
130
-
131
-
132
-
133
-
134
-
135
-
136
-
137
-
138
-
139
-
140
-
141
-
142
-
143
-
144
-
145
-
146
-
147
-
148
-
149
-
150
-
151
-
152
-
153
-
154
-
155
-
156
-
157
-
158
-
159
-
160
-
161
-
162
-
163
-
164
-
165
-
166
-
167
-
168
-
169
 |
 |

04 Unilever Annual Report & Accounts and Form 20-F 2003
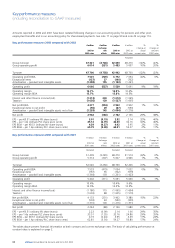
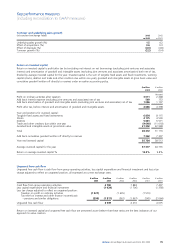
Key performance measures
(including reconciliation to GAAP measures)
Amounts reported in 2002 and 2001 have been restated following changes in our accounting policy for pensions and other post-
employment benefits and in our accounting policy for share-based payments. See note 17 on page 99 and note 29 on page 116.
Key performance measures 2003 compared with 2002
€ million € million € million € million % %
Exchange Change at Change at
2003 at rate 2003 at 2002 at actual constant
2002 rates effects 2003 rates 2002 rates current rates 2002 rates
Restated
Group turnover 47 421 (4 728) 42 693 48 270 (12)% (2)%
Group operating profit 6 014 (531) 5 483 5 007 10% 20%
Turnover 47 700 (4 758) 42 942 48 760 (12)% (2)%
Operating profit BEIA 7 501 (729) 6 772 7 054 (4)% 6%
Exceptional items (137) 37 (100) (702)
Amortisation – goodwill and intangible assets (1 298) 155 (1 143) (1 261)
Operating profit 6 066 (537) 5 529 5 091 9% 19%
Operating margin 12.7% 12.9% 10.4%
Operating margin BEIA 15.7% 15.8% 14.5%
Interest and other finance income/(cost) (1 213) 200 (1 013) (1 065)
Taxation (1 656) 129 (1 527) (1 605)
Net profit BEIA 4 277 (354) 3 923 3 902 1% 10%
Exceptional items in net profit (96) 29 (67) (550)
Amortisation – goodwill and intangible assets net of tax (1 239) 145 (1 094) (1 216)
Net profit 2 942 (180) 2 762 2 136 29% 38%
EPS – per €0.51 ordinary NV share (euros) 3.01 (0.19) 2.82 2.14 32% 40%
EPS – per 1.4p ordinary PLC share (euro cents) 45.12 (2.79) 42.33 32.16 32% 40%
EPS BEIA – per €0.51 ordinary NV share (euros) 4.39 (0.37) 4.02 3.95 2% 11%
EPS BEIA – per 1.4p ordinary PLC share (euro cents) 65.79 (5.48) 60.31 59.27 2% 11%
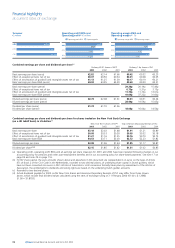
Key performance measures 2002 compared with 2001
€ million € million € million € million % %
Exchange Change at Change at
2002 at rate 2002 at 2001 at actual constant
2001 rates effects 2002 rates 2001 rates current rates 2001 rates
Restated Restated Restated
Group turnover 51 499 (3 229) 48 270 51 514 (6)% 0%
Group operating profit 5 314 (307) 5 007 4 946 1% 7%
Turnover 52 020 (3 260) 48 760 52 206 (7)% 0%
Operating profit BEIA 7 533 (479) 7 054 7 032 0% 7%
Exceptional items (767) 65 (702) (579)
Amortisation – goodwill and intangible assets (1 364) 103 (1 261) (1 423)
Operating profit 5 402 (311) 5 091 5 030 1% 7%
Operating margin 10.4% 10.4% 9.6%
Operating margin BEIA 14.5% 14.5% 13.5%
Interest and other finance income/(cost) (1 180) 115 (1 065) (1 604)
Taxation (1 693) 88 (1 605) (1 519)
Net profit BEIA 4 133 (231) 3 902 3 380 15% 22%
Exceptional items in net profit (593) 43 (550) (329)
Amortisation – goodwill and intangible assets net of tax (1 316) 100 (1 216) (1 371)
Net profit 2 224 (88) 2 136 1 680 27% 32%
EPS – per €0.51 ordinary NV share (euros) 2.23 (0.09) 2.14 1.66 29% 35%
EPS – per 1.4p ordinary PLC share (euro cents) 33.51 (1.35) 32.16 24.86 29% 35%
EPS BEIA – per €0.51 ordinary NV share (euros) 4.19 (0.24) 3.95 3.39 17% 24%
EPS BEIA – per 1.4p ordinary PLC share (euro cents) 62.81 (3.54) 59.27 50.80 17% 24%
The tables above present financial information at both constant and current exchange rates. The basis of calculating performance at
constant rates is explained on page 2.