Unilever 2003 Annual Report Download - page 10
Download and view the complete annual report
Please find page 10 of the 2003 Unilever annual report below. You can navigate through the pages in the report by either clicking on the pages listed below, or by using the keyword search tool below to find specific information within the annual report.-
 1
1 -
 2
2 -
 3
3 -
 4
4 -
 5
5 -
 6
6 -
 7
7 -
 8
8 -
 9
9 -
 10
10 -
 11
11 -
 12
12 -
 13
13 -
 14
14 -
 15
15 -
 16
16 -
 17
17 -
 18
18 -
 19
19 -
 20
20 -
 21
21 -
22
-
23
-
24
-
25
-
26
-
27
-
28
-
29
-
30
-
31
-
32
-
33
-
34
-
35
-
36
-
37
-
38
-
39
-
40
-
41
-
42
-
43
-
44
-
45
-
46
-
47
-
48
-
49
-
50
-
51
-
52
-
53
-
54
-
55
-
56
-
57
-
58
-
59
-
60
-
61
-
62
-
63
-
64
-
65
-
66
-
67
-
68
-
69
-
70
-
71
-
72
-
73
-
74
-
75
-
76
-
77
-
78
-
79
-
80
-
81
-
82
-
83
-
84
-
85
-
86
-
87
-
88
-
89
-
90
-
91
-
92
-
93
-
94
-
95
-
96
-
97
-
98
-
99
-
100
-
101
-
102
-
103
-
104
-
105
-
106
-
107
-
108
-
109
-
110
-
111
-
112
-
113
-
114
-
115
-
116
-
117
-
118
-
119
-
120
-
121
-
122
-
123
-
124
-
125
-
126
-
127
-
128
-
129
-
130
-
131
-
132
-
133
-
134
-
135
-
136
-
137
-
138
-
139
-
140
-
141
-
142
-
143
-
144
-
145
-
146
-
147
-
148
-
149
-
150
-
151
-
152
-
153
-
154
-
155
-
156
-
157
-
158
-
159
-
160
-
161
-
162
-
163
-
164
-
165
-
166
-
167
-
168
-
169
 |
 |
Unilever Annual Report & Accounts and Form 20-F 2003 07
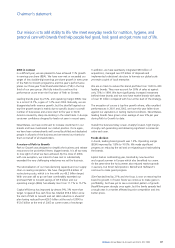
Chairmen’s statement
2003 in context
In a difficult year, we are pleased to have achieved 11% growth
in earnings per share (BEIA). We have now met or exceeded our
target of low double-digit earnings per share growth in every year
of the Path to Growth programme and this year’s performance
places our three-year Total Shareholder Return (TSR) in the top
third of our peer group. We fully intend to continue this
performance as we enter the final year of Path to Growth.
Leading brands grew by 2.5%, and operating margin (BEIA) rose
to a record 15.7%, a gain of 1.2% over 2002. Naturally, we are
disappointed with revenue growth, but the shortfall against our
top-line growth target is mainly due to specific issues in a small
number of businesses and a slow start to the year in North
America caused by sharp de-stocking in the retail trade. In Europe
consumer confidence dropped to levels not seen in recent years.
Nevertheless, we have continued to increase investment in our
brands and have maintained our market position. Once again,
we have been extraordinarily well served by skilled and dedicated
people in all parts of the business and we extend our thanks to
them on behalf of all shareholders.
A review of Path to Growth
Path to Growth was designed to simplify the business and release
resources to be put behind fewer, bigger brands. It is all too easy
to lose sight of what we have achieved. By the close of 2004,
with one exception, we intend to have met or substantially
exceeded the very challenging milestones we set the business.
The rationalisation of our manufacturing capacity and our supply
chain is nearing completion. We have charged €5.4 billion of
restructuring costs, which is in line with our €6.2 billion target.
With one year still to go we have comfortably exceeded our
promised Path to Growth savings of €3.9 billion and our
operating margin (BEIA) has already risen from 11.1% to 15.7%.
Capital efficiency has improved by almost 9%, 3% more than
target. Ungeared free cash flow has totalled €16.4 billion since
the start of Path to Growth and net debt reduction is ahead of
plan having reduced from €26.5 billion at the end of 2000 to
€12.6 billion at the end of 2003 at current rates of exchange.
In addition, we have seamlessly integrated €30 billion of
acquisitions, managed over €7 billion of disposals and
implemented a divisional structure to harness our global scale
yet retain a spirit of local enterprise.
We are on track to reduce the brand portfolio from 1 600 to 400
leading brands. They now account for 93% of sales as against
only 75% in 1999. We have significantly increased investment
behind these brands and we now have twelve brands with sales
of over €1 billion compared with four at the start of the strategy.
The exception of course is top-line growth where, after excellent
performances in 2001 and 2002, we have this year fallen short
against our aspirations in testing market conditions. Nevertheless,
leading brands have grown at an average of over 4% per year
during Path to Growth to date.
Overall the business today is lean, sharply focused, high margin,
strongly cash generating and delivering significant incremental
value each year.
Foods division
In Foods, leading brand growth was 1.2%. Operating margin
(BEIA) improved by 1.8% to 16.0%. We made significant
progress on reducing the tail and on migrating and rationalising
the brands.
Lipton had an outstanding year, boosted by new launches
and a good summer in Europe which also benefited ice cream.
At the same time the hot summer also reduced market growth
in savoury, but Knorr held position. Bertolli and Hellmann’s
continue to make good progress.
Slim•Fast declined by 21% and the focus is now on restoring the
brand to growth. In frozen foods we continue to make gains in
profitability, but have yet to see a consistent pattern of growth.
Becel/Flora grew strongly once again, but the family spreads had
a tough year in a market affected by price competition and low
butter prices.
Our mission is to add vitality to life. We meet everyday needs for nutrition, hygiene, and
personal care with brands that help people feel good, look good and get more out of life.