US Bank 2009 Annual Report Download - page 5
Download and view the complete annual report
Please find page 5 of the 2009 US Bank annual report below. You can navigate through the pages in the report by either clicking on the pages listed below, or by using the keyword search tool below to find specific information within the annual report.-
 1
1 -
 2
2 -
 3
3 -
 4
4 -
 5
5 -
 6
6 -
 7
7 -
 8
8 -
 9
9 -
 10
10 -
 11
11 -
 12
12 -
 13
13 -
 14
14 -
 15
15 -
 16
16 -
17
-
18
-
19
-
20
-
21
-
22
-
23
-
24
-
25
-
26
-
27
-
28
-
29
-
30
-
31
-
32
-
33
-
34
-
35
-
36
-
37
-
38
-
39
-
40
-
41
-
42
-
43
-
44
-
45
-
46
-
47
-
48
-
49
-
50
-
51
-
52
-
53
-
54
-
55
-
56
-
57
-
58
-
59
-
60
-
61
-
62
-
63
-
64
-
65
-
66
-
67
-
68
-
69
-
70
-
71
-
72
-
73
-
74
-
75
-
76
-
77
-
78
-
79
-
80
-
81
-
82
-
83
-
84
-
85
-
86
-
87
-
88
-
89
-
90
-
91
-
92
-
93
-
94
-
95
-
96
-
97
-
98
-
99
-
100
-
101
-
102
-
103
-
104
-
105
-
106
-
107
-
108
-
109
-
110
-
111
-
112
-
113
-
114
-
115
-
116
-
117
-
118
-
119
-
120
-
121
-
122
-
123
-
124
-
125
-
126
-
127
-
128
-
129
-
130
-
131
-
132
-
133
-
134
-
135
-
136
-
137
-
138
-
139
-
140
-
141
-
142
-
143
 |
 |

U.S. BANCORP 3
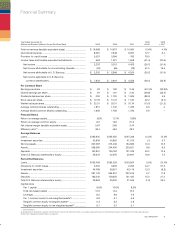
Year Ended December 31 2009 2008
(Dollars and Shares in Millions, Except Per Share Data) 2009 2008 2007 v 2008 v 2007
Total net revenue (taxable-equivalent basis) ............................... $ 16,668 $ 14,677 $ 14,060 13.6% 4.4%
Noninterest expense ................................................................... 8,281 7,348 6,907 12.7 6.4
Provision for credit losses ........................................................... 5,557 3,096 792 79.5 *
Income taxes and taxable-equivalent adjustments ...................... 593 1,221 1,958 (51.4) (37.6)
Net income .............................................................................. 2,237 3,012 4,403 (25.7) (31.6)
Net income attributable to noncontrolling interests ................. (32) (66) (79) 51.5 16.5
Net income attributable to U.S. Bancorp ................................. $ 2,205 $ 2,946 $ 4,324 (25.2) (31.9)
Net income applicable to U.S. Bancorp
common shareholders.......................................................... $ 1,803 $ 2,819 $ 4,258 (36.0) (33.8)
Per Common Share
Earnings per share ....................................................................... $ .97 $ 1.62 $ 2.45 (40.1)% (33.9)%
Diluted earnings per share ........................................................... $ .97 $ 1.61 $ 2.42 (39.8) (33.5)
Dividends declared per share ....................................................... $ .200 $ 1.700 $ 1.625 (88.2) 4.6
Book value per share .................................................................... $ 12.79 $ 10.47 $ 11.60 22.2 (9.7)
Market value per share ................................................................. $ 22.51 $ 25.01 $ 31.74 (10.0) (21.2)
Average common shares outstanding .......................................... 1,851 1,742 1,735 6.3 .4
Average diluted common shares outstanding .............................. 1,859 1,756 1,756 5.9 –
Financial Ratios
Return on average assets............................................................. .82% 1.21% 1.93%
Return on average common equity .............................................. 8.2 13.9 21.3
Net interest margin (taxable-equivalent basis) ............................. 3.67 3.66 3.47
Effi ciency ratio(a)............................................................................ 48.4 46.9 49.2
Average Balances
Loans ............................................................................................ $185,805 $165,552 $147,348 12.2% 12.4%
Investment securities ................................................................... 42,809 42,850 41,313 (.1) 3.7
Earning assets .............................................................................. 237,287 215,046 194,683 10.3 10.5
Assets ........................................................................................... 268,360 244,400 223,621 9.8 9.3
Deposits ....................................................................................... 167,801 136,184 121,075 23.2 12.5
Total U.S. Bancorp shareholders’ equity ...................................... 26,307 22,570 20,997 16.6 7.5
Period End Balances
Loans ............................................................................................ $195,408 $185,229 $153,827 5.5% 20.4%
Allowance for credit losses .......................................................... 5,264 3,639 2,260 44.7 61.0
Investment securities ................................................................... 44,768 39,521 43,116 13.3 (8.3)
Assets ........................................................................................... 281,176 265,912 237,615 5.7 11.9
Deposits ....................................................................................... 183,242 159,350 131,445 15.0 21.2
Total U.S. Bancorp shareholders’ equity ...................................... 25,963 26,300 21,046 (1.3) 25.0
Capital ratios
Tier 1 capital ............................................................................ 9.6% 10.6% 8.3%
Total risk-based capital ........................................................... 12.9 14.3 12.2
Leverage ................................................................................... 8.5 9.8 7.9
Tier 1 common equity to risk-weighted assets(b) ...................... 6.8 5.1 5.6
Tangible common equity to tangible assets(b) .......................... 5.3 3.3 4.8
Tangible common equity to risk-weighted assets(b) ................. 6.1 3.7 5.1
* Not meaningful
(a) Computed as noninterest expense divided by the sum of net interest income on a taxable-equivalent basis and noninterest income excluding net securities gains (losses).
(b) See Non-Regulatory Capital Ratios on page 61.
Financial Summary