US Bank 2008 Annual Report Download - page 5
Download and view the complete annual report
Please find page 5 of the 2008 US Bank annual report below. You can navigate through the pages in the report by either clicking on the pages listed below, or by using the keyword search tool below to find specific information within the annual report.-
 1
1 -
 2
2 -
 3
3 -
 4
4 -
 5
5 -
 6
6 -
 7
7 -
 8
8 -
 9
9 -
 10
10 -
 11
11 -
 12
12 -
 13
13 -
 14
14 -
 15
15 -
 16
16 -
17
-
18
-
19
-
20
-
21
-
22
-
23
-
24
-
25
-
26
-
27
-
28
-
29
-
30
-
31
-
32
-
33
-
34
-
35
-
36
-
37
-
38
-
39
-
40
-
41
-
42
-
43
-
44
-
45
-
46
-
47
-
48
-
49
-
50
-
51
-
52
-
53
-
54
-
55
-
56
-
57
-
58
-
59
-
60
-
61
-
62
-
63
-
64
-
65
-
66
-
67
-
68
-
69
-
70
-
71
-
72
-
73
-
74
-
75
-
76
-
77
-
78
-
79
-
80
-
81
-
82
-
83
-
84
-
85
-
86
-
87
-
88
-
89
-
90
-
91
-
92
-
93
-
94
-
95
-
96
-
97
-
98
-
99
-
100
-
101
-
102
-
103
-
104
-
105
-
106
-
107
-
108
-
109
-
110
-
111
-
112
-
113
-
114
-
115
-
116
-
117
-
118
-
119
-
120
-
121
-
122
-
123
-
124
-
125
-
126
-
127
-
128
-
129
-
130
-
131
-
132
 |
 |

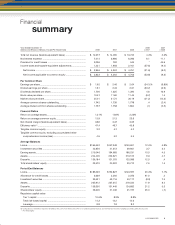
U.S. BANCORP 3
Financial
summary
Year Ended December 31 2008 2007
(Dollars and Shares in Millions, Except Per Share Data) 2008 2007 2006 v 2007 v 2006
Total net revenue (taxable-equivalent basis) ............................... $ 14,677 $ 14,060 $ 13,742 4.4% 2.3%
Noninterest expense ................................................................... 7,414 6,986 6,286 6.1 11.1
Provision for credit losses ........................................................... 3,096 792 544 * 45.6
Income taxes and taxable-equivalent adjustments ...................... 1,221 1,958 2,161 (37.6) (9.4)
Net income .............................................................................. $ 2,946 $ 4,324 $ 4,751 (31.9) (9.0)
Net income applicable to common equity ............................... $ 2,823 $ 4,264 $ 4,703 (33.8) (9.3)
Per Common Share
Earnings per share ....................................................................... $ 1.62 $ 2.46 $ 2.64 (34.1)% (6.8)%
Diluted earnings per share ........................................................... 1.61 2.43 2.61 (33.7) (6.9)
Dividends declared per share ....................................................... 1.700 1.625 1.390 4.6 16.9
Book value per share .................................................................... 10.47 11.60 11.44 (9.7) 1.4
Market value per share ................................................................. 25.01 31.74 36.19 (21.2) (12.3)
Average common shares outstanding .......................................... 1,742 1,735 1,778 .4 (2.4)
Average diluted common shares outstanding .............................. 1,757 1,758 1,804 (.1) (2.5)
Financial Ratios
Return on average assets............................................................. 1.21% 1.93% 2.23%
Return on average common equity .............................................. 13.9 21.3 23.6
Net interest margin (taxable-equivalent basis) ............................. 3.66 3.47 3.65
Effi ciency ratio(a) ........................................................................... 47.4 49.7 45.8
Tangible common equity .............................................................. 3.2 4.7 5.2
Tangible common equity, excluding accumulated other
comprehensive income (loss) ................................................... 4.5 5.2 5.5
Average Balances
Loans ............................................................................................ $165,552 $147,348 $140,601 12.4% 4.8%
Investment securities ................................................................... 42,850 41,313 39,961 3.7 3.4
Earning assets .............................................................................. 215,046 194,683 186,231 10.5 4.5
Assets ........................................................................................... 244,400 223,621 213,512 9.3 4.7
Deposits ....................................................................................... 136,184 121,075 120,589 12.5 .4
Total shareholders’ equity ............................................................ 22,570 20,997 20,710 7.5 1.4
Period End Balances
Loans ............................................................................................ $185,229 $153,827 $143,597 20.4% 7.1%
Allowance for credit losses .......................................................... 3,639 2,260 2,256 61.0 .2
Investment securities ................................................................... 39,521 43,116 40,117 (8.3) 7.5
Assets ........................................................................................... 265,912 237,615 219,232 11.9 8.4
Deposits ....................................................................................... 159,350 131,445 124,882 21.2 5.3
Shareholders’ equity .................................................................... 26,300 21,046 21,197 25.0 (.7)
Regulatory capital ratios
Tier 1 capital ............................................................................ 10.6% 8.3% 8.8%
Total risk-based capital ........................................................... 14.3 12.2 12.6
Leverage ................................................................................... 9.8 7.9 8.2
(a) Computed as noninterest expense divided by the sum of net interest income on a taxable-equivalent basis and noninterest income excluding securities gains (losses), net.
* Not meaningful
F