US Bank 2008 Annual Report Download - page 4
Download and view the complete annual report
Please find page 4 of the 2008 US Bank annual report below. You can navigate through the pages in the report by either clicking on the pages listed below, or by using the keyword search tool below to find specific information within the annual report.-
 1
1 -
 2
2 -
 3
3 -
 4
4 -
 5
5 -
 6
6 -
 7
7 -
 8
8 -
 9
9 -
 10
10 -
 11
11 -
 12
12 -
 13
13 -
 14
14 -
 15
15 -
16
-
17
-
18
-
19
-
20
-
21
-
22
-
23
-
24
-
25
-
26
-
27
-
28
-
29
-
30
-
31
-
32
-
33
-
34
-
35
-
36
-
37
-
38
-
39
-
40
-
41
-
42
-
43
-
44
-
45
-
46
-
47
-
48
-
49
-
50
-
51
-
52
-
53
-
54
-
55
-
56
-
57
-
58
-
59
-
60
-
61
-
62
-
63
-
64
-
65
-
66
-
67
-
68
-
69
-
70
-
71
-
72
-
73
-
74
-
75
-
76
-
77
-
78
-
79
-
80
-
81
-
82
-
83
-
84
-
85
-
86
-
87
-
88
-
89
-
90
-
91
-
92
-
93
-
94
-
95
-
96
-
97
-
98
-
99
-
100
-
101
-
102
-
103
-
104
-
105
-
106
-
107
-
108
-
109
-
110
-
111
-
112
-
113
-
114
-
115
-
116
-
117
-
118
-
119
-
120
-
121
-
122
-
123
-
124
-
125
-
126
-
127
-
128
-
129
-
130
-
131
-
132
 |
 |

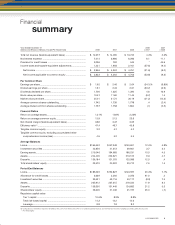
2 U.S. BANCORP
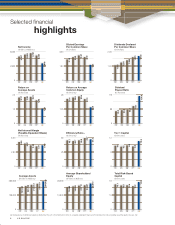
Net Income
(Dollars in Millions)
5,000
2,500
004 05 06 07 08
4,167
4,489
4,751
4,324
08
08
2,946
Diluted Earnings
Per Common Share
(In Dollars)
3.00
1.50
004 05 06 07 08
2.18
2.42
2.61
2.43
08
08
1.61
Dividends Declared
Per Common Share
(In Dollars)
2.00
1.00
004 05 06 07 08
1.020
1.230
1.390
1.625
08
8
1.700
Selected fi nancial
highlights
Return on
Average Assets
(In Percents)
2.4
1.2
004 05 06 07 08
2.17
2.21
2.23
1.93
08
08
1.21
Return on Average
Common Equity
(In Percents)
25
12.5
004 05 06 07 08
21.4
22.5
23.6
21.3
08
08
13.9
Dividend
Payout Ratio
(In Percents)
110
55
004 05 06 07 08
46.2
50.2
52.7
66.1
08
08
104.9
Net Interest Margin
(Taxable-Equivalent Basis)
(In Percents)
5.00
2.50
004 05 06 07 08
4.25
3.97
3.65
3.47
08
08
3.66
Average Assets
(Dollars in Millions)
250,000
125,000
004 05 06 07 08
191,593
203,198
213,512
223,621
08
08
,
244,400
Efficiency Ratio(a)
(In Percents)
50
25
004 05 06 07 08
45.7
44.7
45.8
49.7
08
08
47.4
Tier 1 Capital
(In Percents)
12
6
004 05 06 07 08
8.6
8.2
8.8
8.3
08
08
10.6
Average Shareholders’
Equity
(Dollars in Millions)
25,000
12,500
004 05 06 07 08
19,459
19,953
20,710
20,997
08
08
,
22,570
Total Risk-Based
Capital
(In Percents)
15
7.5
004 05 06 07 08
13.1
12.5
12.6
12.2
08
08
14.3
(a) Computed as noninterest expense divided by the sum of net interest income on a taxable-equivalent basis and noninterest income excluding securities gains (losses), net.