US Bank 2006 Annual Report Download - page 7
Download and view the complete annual report
Please find page 7 of the 2006 US Bank annual report below. You can navigate through the pages in the report by either clicking on the pages listed below, or by using the keyword search tool below to find specific information within the annual report.-
 1
1 -
 2
2 -
 3
3 -
 4
4 -
 5
5 -
 6
6 -
 7
7 -
 8
8 -
 9
9 -
 10
10 -
 11
11 -
 12
12 -
 13
13 -
 14
14 -
 15
15 -
 16
16 -
 17
17 -
 18
18 -
19
-
20
-
21
-
22
-
23
-
24
-
25
-
26
-
27
-
28
-
29
-
30
-
31
-
32
-
33
-
34
-
35
-
36
-
37
-
38
-
39
-
40
-
41
-
42
-
43
-
44
-
45
-
46
-
47
-
48
-
49
-
50
-
51
-
52
-
53
-
54
-
55
-
56
-
57
-
58
-
59
-
60
-
61
-
62
-
63
-
64
-
65
-
66
-
67
-
68
-
69
-
70
-
71
-
72
-
73
-
74
-
75
-
76
-
77
-
78
-
79
-
80
-
81
-
82
-
83
-
84
-
85
-
86
-
87
-
88
-
89
-
90
-
91
-
92
-
93
-
94
-
95
-
96
-
97
-
98
-
99
-
100
-
101
-
102
-
103
-
104
-
105
-
106
-
107
-
108
-
109
-
110
-
111
-
112
-
113
-
114
-
115
-
116
-
117
-
118
-
119
-
120
-
121
-
122
-
123
-
124
-
125
-
126
-
127
-
128
-
129
-
130
 |
 |

U.S. BANCORP 5
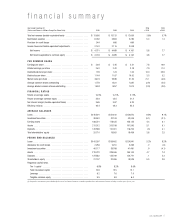
financial summary
Year Ended December 31 2006 2005
(Dollars and Shares in Millions, Except Per Share Data) 2006 2005 2004 v 2005 v 2004
Total net revenue (taxable-equivalent basis) . . . . . . . . . . . . . . . . . . . . $ 13,636 $ 13,133 $ 12,659 3.8% 3.7%
Noninterest expense . . . . . . . . . . . . . . . . . . . . . . . . . . . . . . . . . . . . . . 6,180 5,863 5,785 5.4 1.3
Provision for credit losses . . . . . . . . . . . . . . . . . . . . . . . . . . . . . . . . . . 544 666 669
Income taxes and taxable-equivalent adjustments . . . . . . . . . . . . . . . . 2,161 2,115 2,038
Net Income . . . . . . . . . . . . . . . . . . . . . . . . . . . . . . . . . . . . . . . . . . $ 4,751 $ 4,489 $ 4,167 5.8 7.7
Net Income applicable to common equity . . . . . . . . . . . . . . . . . . . . $ 4,703 $ 4,489 $ 4,167 4.8 7.7
PER COMMON SHARE
Earnings per share . . . . . . . . . . . . . . . . . . . . . . . . . . . . . . . . . . . . . . . . $ 2.64 $ 2.45 $ 2.21 7.8 10.9
Diluted earnings per share . . . . . . . . . . . . . . . . . . . . . . . . . . . . . . . . . . 2.61 2.42 2.18 7.9 11.0
Dividends declared per share . . . . . . . . . . . . . . . . . . . . . . . . . . . . . . . . 1.39 1.23 1.02 13.0 20.6
Book value per share . . . . . . . . . . . . . . . . . . . . . . . . . . . . . . . . . . . . . . 11.44 11.07 10.52 3.3 5.2
Market value per share . . . . . . . . . . . . . . . . . . . . . . . . . . . . . . . . . . . . 36.19 29.89 31.32 21.1 (4.6)
Average common shares outstanding . . . . . . . . . . . . . . . . . . . . . . . . . 1,778 1,831 1,887 (2.9) (3.0)
Average diluted common shares outstanding . . . . . . . . . . . . . . . . . . . . 1,804 1,857 1,913 (2.9) (2.9)
FINANCIAL RATIOS
Return on average assets . . . . . . . . . . . . . . . . . . . . . . . . . . . . . . . . . . 2.23% 2.21% 2.17%
Return on average common equity. . . . . . . . . . . . . . . . . . . . . . . . . . . 23.6 22.5 21.4
Net interest margin (taxable-equivalent basis) . . . . . . . . . . . . . . . . . . . 3.65 3.97 4.25
Efficiency ratio (a) . . . . . . . . . . . . . . . . . . . . . . . . . . . . . . . . . . . . . . . . 45.4 44.3 45.3
AVERAGE BALANCES
Loans . . . . . . . . . . . . . . . . . . . . . . . . . . . . . . . . . . . . . . . . . . . . . . . . . . $140,601 $131,610 $120,670 6.8% 9.1%
Investment securities . . . . . . . . . . . . . . . . . . . . . . . . . . . . . . . . . . . . . . 39,961 42,103 43,009 (5.1) (2.1)
Earning assets . . . . . . . . . . . . . . . . . . . . . . . . . . . . . . . . . . . . . . . . . . . 186,231 178,425 168,123 4.4 6.1
Assets . . . . . . . . . . . . . . . . . . . . . . . . . . . . . . . . . . . . . . . . . . . . . . . . . 213,512 203,198 191,593 5.1 6.1
Deposits . . . . . . . . . . . . . . . . . . . . . . . . . . . . . . . . . . . . . . . . . . . . . . . . 120,589 121,001 116,222 (.3) 4.1
Total shareholders’ equity . . . . . . . . . . . . . . . . . . . . . . . . . . . . . . . . . . 20,710 19,953 19,459 3.8 2.5
PERIOD END BALANCES
Loans . . . . . . . . . . . . . . . . . . . . . . . . . . . . . . . . . . . . . . . . . . . . . . . . . . $143,597 $136,462 $124,941 5.2% 9.2%
Allowance for credit losses . . . . . . . . . . . . . . . . . . . . . . . . . . . . . . . . . 2,256 2,251 2,269 .2 (.8)
Investment securities . . . . . . . . . . . . . . . . . . . . . . . . . . . . . . . . . . . . . . 40,117 39,768 41,481 .9 (4.1)
Assets . . . . . . . . . . . . . . . . . . . . . . . . . . . . . . . . . . . . . . . . . . . . . . . . . 219,232 209,465 195,104 4.7 7.4
Deposits . . . . . . . . . . . . . . . . . . . . . . . . . . . . . . . . . . . . . . . . . . . . . . . . 124,882 124,709 120,741 .1 3.3
Shareholders’ equity . . . . . . . . . . . . . . . . . . . . . . . . . . . . . . . . . . . . . . 21,197 20,086 19,539 5.5 2.8
Regulatory capital ratios
Tier 1 capital . . . . . . . . . . . . . . . . . . . . . . . . . . . . . . . . . . . . . . . . . 8.8% 8.2% 8.6%
Total risk-based capital . . . . . . . . . . . . . . . . . . . . . . . . . . . . . . . . . 12.6 12.5 13.1
Leverage . . . . . . . . . . . . . . . . . . . . . . . . . . . . . . . . . . . . . . . . . . . . . 8.2 7.6 7.9
Tangible common equity . . . . . . . . . . . . . . . . . . . . . . . . . . . . . . . . 5.5 5.9 6.4
(a) Computed as noninterest expense divided by the sum of net interest income on a taxable-equivalent basis and noninterest income excluding securities gains (losses), net.