Twenty-First Century Fox 2003 Annual Report Download - page 7
Download and view the complete annual report
Please find page 7 of the 2003 Twenty-First Century Fox annual report below. You can navigate through the pages in the report by either clicking on the pages listed below, or by using the keyword search tool below to find specific information within the annual report.-
 1
1 -
 2
2 -
 3
3 -
 4
4 -
 5
5 -
 6
6 -
 7
7 -
 8
8 -
 9
9 -
 10
10 -
 11
11 -
 12
12 -
 13
13 -
 14
14 -
 15
15 -
 16
16 -
 17
17 -
 18
18 -
19
-
20
-
21
-
22
-
23
-
24
-
25
-
26
-
27
-
28
-
29
-
30
-
31
-
32
-
33
-
34
-
35
-
36
-
37
-
38
-
39
-
40
-
41
-
42
-
43
-
44
-
45
-
46
-
47
-
48
-
49
-
50
-
51
-
52
-
53
-
54
-
55
-
56
-
57
-
58
-
59
-
60
-
61
-
62
-
63
-
64
-
65
-
66
-
67
-
68
-
69
-
70
-
71
-
72
-
73
-
74
-
75
-
76
-
77
-
78
-
79
-
80
-
81
-
82
-
83
-
84
 |
 |

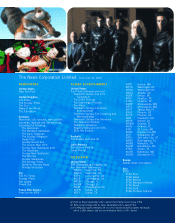
5The News Corporation Limited
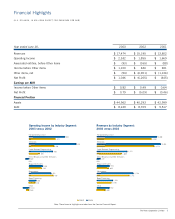
641
473
851
458
430
199
256
(68)
235
N/A
400
430
133
118
(111)
(58)
Filmed Entertainment
Television
Cable Network Programming
Direct Broadcast Satellite Television
Magazines/Inserts
Newspapers
Book Publishing
Other
4,486
4,040
4,763
4,274
2,270
1,869
923
864
2,718
2,411
1,162
1,078
932
659
220
N/A
Filmed Entertainment
Television
Cable Network Programming
Direct Broadcast Satellite Television
Magazines/Inserts
Newspapers
Book Publishing
Other
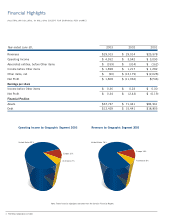
Year ended June 30, 2003 2002 2001
Revenues $17,474 $ 15,195 $ 13,802
Operating Income $ 2,532 $ 1,855 $ 1,669
Associated entities, before Other items $ (93) $ (165) $ (88)
Income before Other items $ 1,100 $ 636 $ 691
Other items, net $ (54) $ (6,901) $ (1,136)
Net Profit $1,046 $ (6,265) $ (445)
Earnings per ADR
Income before Other items $ 0.83 $ 0.49 $ 0.64
Net Profit $0.79 $ (5.09) $ (0.46)
Financial Position
Assets $44,963 $ 40,293 $ 42,999
Debt $8,249 $ 8,709 $ 9,517
Financial Highlights
(U.S. DOLLARS, IN MILLIONS EXCEPT FOR EARNINGS PER ADR)
Operating Income by Industry Segment:
2003 versus 2002
■2002 ■2003
Note: These financial highlights are taken from the Concise Financial Report.
Revenues by Industry Segment:
2003 versus 2002