Twenty-First Century Fox 2003 Annual Report Download - page 6
Download and view the complete annual report
Please find page 6 of the 2003 Twenty-First Century Fox annual report below. You can navigate through the pages in the report by either clicking on the pages listed below, or by using the keyword search tool below to find specific information within the annual report.-
 1
1 -
 2
2 -
 3
3 -
 4
4 -
 5
5 -
 6
6 -
 7
7 -
 8
8 -
 9
9 -
 10
10 -
 11
11 -
 12
12 -
 13
13 -
 14
14 -
 15
15 -
 16
16 -
 17
17 -
18
-
19
-
20
-
21
-
22
-
23
-
24
-
25
-
26
-
27
-
28
-
29
-
30
-
31
-
32
-
33
-
34
-
35
-
36
-
37
-
38
-
39
-
40
-
41
-
42
-
43
-
44
-
45
-
46
-
47
-
48
-
49
-
50
-
51
-
52
-
53
-
54
-
55
-
56
-
57
-
58
-
59
-
60
-
61
-
62
-
63
-
64
-
65
-
66
-
67
-
68
-
69
-
70
-
71
-
72
-
73
-
74
-
75
-
76
-
77
-
78
-
79
-
80
-
81
-
82
-
83
-
84
 |
 |

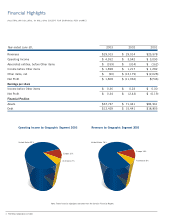
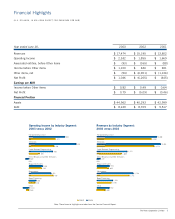
Revenues by Geographic Segment 2003
Europe 16%
United States 76%
Australasia 8%
Year ended June 30, 2003 2002 2001
Revenues $29,913 $ 29,014 $25,578
Operating Income $ 4,352 $ 3,542 $ 3,093
Associated entities, before Other items $ (159) $ (314) $ (162)
Income before Other items $ 1,898 $ 1,217 $ 1,282
Other items, net $ (90) $ (13,179) $ (2,028)
Net Profit $ 1,808 $ (11,962) $(746)
Earnings per share
Income before Other items $ 0.36 $ 0.23 $ 0.30
Net Profit $ 0.34 $ (2.43) $ (0.19)
Financial Position
Assets $67,747 $ 71,441 $84,961
Debt $12,429 $ 15,441 $18,805
Operating Income by Geographic Segment 2003
Europe 12%
United States 81%
Australasia 7%
Financial Highlights
(AUSTRALIAN DOLLARS, IN MILLIONS EXCEPT FOR EARNINGS PER SHARE)
Note: These financial highlights are taken from the Concise Financial Report.
4The News Corporation Limited