Toshiba 2012 Annual Report Download - page 7
Download and view the complete annual report
Please find page 7 of the 2012 Toshiba annual report below. You can navigate through the pages in the report by either clicking on the pages listed below, or by using the keyword search tool below to find specific information within the annual report.-
 1
1 -
 2
2 -
 3
3 -
 4
4 -
 5
5 -
 6
6 -
 7
7 -
 8
8 -
 9
9 -
 10
10 -
 11
11 -
 12
12 -
 13
13 -
 14
14 -
 15
15 -
 16
16 -
 17
17 -
 18
18 -
19
-
20
-
21
-
22
-
23
-
24
-
25
-
26
-
27
-
28
-
29
-
30
-
31
-
32
-
33
-
34
-
35
-
36
-
37
-
38
-
39
-
40
-
41
-
42
-
43
-
44
-
45
-
46
-
47
-
48
-
49
-
50
-
51
-
52
-
53
-
54
-
55
-
56
-
57
-
58
-
59
-
60
-
61
-
62
-
63
-
64
-
65
-
66
-
67
-
68
-
69
-
70
-
71
-
72
-
73
-
74
-
75
-
76
-
77
-
78
-
79
-
80
-
81
-
82
-
83
-
84
-
85
-
86
-
87
-
88
-
89
-
90
-
91
-
92
-
93
-
94
-
95
-
96
-
97
-
98
-
99
-
100
-
101
-
102
-
103
-
104
-
105
-
106
-
107
-
108
-
109
-
110
-
111
-
112
-
113
-
114
-
115
-
116
-
117
-
118
-
119
-
120
-
121
-
122
-
123
-
124
-
125
-
126
-
127
-
128
-
129
-
130
-
131
-
132
-
133
-
134
-
135
-
136
-
137
-
138
 |
 |

08 12111009
08 12111009
08 12111009
08 12111009
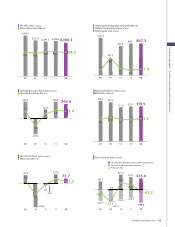
7,404.3
6,512.7 6,291.2 6,398.5 6,100.3
206.6
53.5 52.5 55.6 54.5
3.4
55.4
370.3 357.5
311.8 319.7 319.9
5.0 5.5 5.0
5.2
5.0
240.3
3.8
125.2
2.0
-233.4
-3.6
240.4
3.2
08 12111009
08 12111009
867.3
868.1
797.4
1,022.3
1.4
1.2
1.5
447.3
4.0
1.2
335.0
-377.2
-42.2
374.1
-214.7
159.4
451.4
198.5
-252.9
-335.3
-16.0
-351.3
247.1
-322.7
-75.6
73.7
1.2
137.8
2.2
-0.3
-19.7
-343.6
-5.3
127.4
1.7
Net cash provided by (used in) operating activities
Net cash used in investing activities
Free cash flow
-2
52
252
53
6.
0
4
4
5
9
.
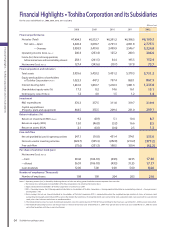
Operating income (loss) (Billions of yen)
Operating income ratio (%)
Net income (loss) (Billions of yen)
Return on sales (%)
Net sales
(Billions of yen)
Ratio of overseas sales (%)
Total equity attributable to shareholders of
Toshiba Corporation
(Billions of yen)
Debt/equity ratio (Times)
Free cash flow (Billions of yen)
R&D expenditures (Billions of yen)
R&D/sales ratio (%)
Financial Highlights • Toshiba Corporation and its Subsidiaries
05
TOSHIBA Annual Report 2012