Toshiba 2012 Annual Report Download - page 6
Download and view the complete annual report
Please find page 6 of the 2012 Toshiba annual report below. You can navigate through the pages in the report by either clicking on the pages listed below, or by using the keyword search tool below to find specific information within the annual report.-
 1
1 -
 2
2 -
 3
3 -
 4
4 -
 5
5 -
 6
6 -
 7
7 -
 8
8 -
 9
9 -
 10
10 -
 11
11 -
 12
12 -
 13
13 -
 14
14 -
 15
15 -
 16
16 -
 17
17 -
18
-
19
-
20
-
21
-
22
-
23
-
24
-
25
-
26
-
27
-
28
-
29
-
30
-
31
-
32
-
33
-
34
-
35
-
36
-
37
-
38
-
39
-
40
-
41
-
42
-
43
-
44
-
45
-
46
-
47
-
48
-
49
-
50
-
51
-
52
-
53
-
54
-
55
-
56
-
57
-
58
-
59
-
60
-
61
-
62
-
63
-
64
-
65
-
66
-
67
-
68
-
69
-
70
-
71
-
72
-
73
-
74
-
75
-
76
-
77
-
78
-
79
-
80
-
81
-
82
-
83
-
84
-
85
-
86
-
87
-
88
-
89
-
90
-
91
-
92
-
93
-
94
-
95
-
96
-
97
-
98
-
99
-
100
-
101
-
102
-
103
-
104
-
105
-
106
-
107
-
108
-
109
-
110
-
111
-
112
-
113
-
114
-
115
-
116
-
117
-
118
-
119
-
120
-
121
-
122
-
123
-
124
-
125
-
126
-
127
-
128
-
129
-
130
-
131
-
132
-
133
-
134
-
135
-
136
-
137
-
138
 |
 |

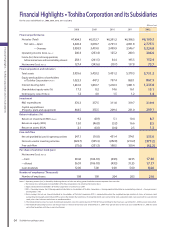
Notes: 1. Operating income (loss) is derived by deducting the cost of sales and selling, general and administrative expenses from net sales.
2. Net income (loss) attributable to shareholders of Toshiba Corporation is described as Net income (loss).
3. Equity attributable to shareholders of Toshiba Corporation is based on U.S. GAAP.
4. ROI = Operating income (loss)/(Average equity attributable to shareholders of Toshiba Corporation + Average equity attributable to noncontrolling interests + Average interest-
bearing debt) × 100
5. Basic earnings (losses) per share attributable to shareholders of Toshiba Corporation (EPS) is computed based on the weighted-average number of shares of common stock
outstanding during each period. Diluted EPS assumes the dilution that could occur if convertible bonds were converted or stock acquisition rights were exercised to issue common
stock, unless their inclusion would have an antidilutive e ect.
6. The mobile phone business has been discontinued operations since the second quarter of FY2010. Prior-period data for the fiscal years up to March 31, 2010 has been reclassified.
7. The Mobile Broadcasting business ceased operation at the end of the fiscal year ended March 31, 2009. Prior-period data to the fiscal year ended March 31, 2008 has been
reclassi ed to conform with the current classi cation.
(Billions of yen)
2008 2009 2010 2011 2012
Financial performance
Net sales (Total) ¥7,404.3 ¥6,512.7 ¥6,291.2 ¥6,398.5 ¥6,100.3
Net sales—Japan 3,445.4 3,093.7 2,791.3 2,851.8 2,775.5
—Overseas 3,958.9 3,419.0 3,499.9 3,546.7 3,324.8
Operating income (loss)
(Note 1) 240.4 (233.4) 125.2 240.3 206.6
Income (loss) from continuing operations,
before income taxes and noncontrolling interests
258.1 (261.5) 34.4 195.5 152.4
Net income (loss) (Note 2) 127.4 (343.6) (19.7) 137.8 73.7
Financial position and indicators
Total assets 5,935.6 5,453.2 5,451.2 5,379.3 5,731.2
Equity attributable to shareholders
of Toshiba Corporation (Note 3) 1,022.3 447.3 797.4 868.1 867.3
Interest-bearing debt 1,261.0 1,810.7 1,218.3 1,081.3 1,235.8
Shareholders’ equity ratio (%) 17.2 8.2 14.6 16.1 15.1
Debt/equity ratio (Times)
1.2 4.0 1.5 1.2 1.4
Investment
R&D expenditures 370.3 357.5 311.8 319.7 319.9
Capital expenditures
(Property, plant and equipment) 464.5 355.5 209.4 231.0 299.1
Return indicators (%)
Return on investment (ROI) (Note 4) 9.2 (8.9) 5.1 10.4 8.7
Return on equity (ROE) 12.0 (46.8) (3.2) 16.6 8.5
Return on assets (ROA) 2.1 (6.0) (0.4) 2.5 1.3
Free cash flow
Net cash provided by (used in) operating activities
247.1 (16.0) 451.4 374.1 335.0
Net cash used in investing activities (322.7) (335.3) (252.9) (214.7) (377.2)
Free cash flow (75.6) (351.3) 198.5 159.4 (42.2)
Per share of common stock (yen)
Net income (loss) (Note 5)
—basic 39.46 (106.18) (4.93) 32.55 17.40
—diluted 36.59 (106.18) (4.93) 31.25 17.17
Cash dividends 12.00 5.00 0.00 5.00 8.00
Number of employees (Thousands)
Number of employees 198 199 204 203 210
Financial Highlights
•
Toshiba Corporation and its Subsidiaries
For the years ended March 31, 2008, 2009, 2010, 2011 and 2012
Financial Highlights • Toshiba Corporation and its Subsidiaries
04 TOSHIBA Annual Report 2012