TomTom 2007 Annual Report Download - page 25
Download and view the complete annual report
Please find page 25 of the 2007 TomTom annual report below. You can navigate through the pages in the report by either clicking on the pages listed below, or by using the keyword search tool below to find specific information within the annual report.-
 1
1 -
2
-
3
-
4
-
5
-
6
-
7
-
8
-
9
-
10
-
11
-
12
-
13
-
14
-
 15
15 -
 16
16 -
 17
17 -
 18
18 -
 19
19 -
 20
20 -
 21
21 -
 22
22 -
 23
23 -
 24
24 -
 25
25 -
 26
26 -
 27
27 -
 28
28 -
 29
29 -
 30
30 -
 31
31 -
 32
32 -
 33
33 -
 34
34 -
 35
35 -
36
-
37
-
38
-
39
-
40
-
41
-
42
-
43
-
44
-
45
-
46
-
47
-
48
-
49
-
50
-
51
-
52
-
53
-
54
-
55
-
56
-
57
-
58
-
59
-
60
-
61
-
62
-
63
-
64
-
65
-
66
-
67
-
68
-
69
-
70
-
71
-
72
-
73
-
74
-
75
-
76
-
77
-
78
-
79
-
80
-
81
-
82
-
83
-
84
-
85
-
86
-
87
-
88
 |
 |

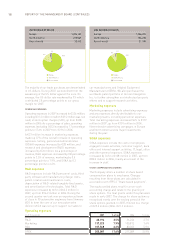
In 2007, we adopted a performance-based share
plan which replaced the 2005 share option plan.
The charges for the performance-based share plan
are determined by an option pricing model that
simulates the expected result of performance
criteria approved by the Supervisory Board. The
performance criteria selected are earnings per
share (EPS) growth, and total shareholder return
(TSR). In 2007 TomTom recorded a charge of €2.1
million in respect of this plan (2006: €0million).
FINANCIAL INCOME AND EXPENSES
We recorded a net gain of €2.8 million in financial
income and expenses in 2007, compared to a net
charge of €24.7 million in 2006. Exchange rate
results resulted in a charge of €16.3 million for
2007 compared to a charge of €32.3 million in 2006.
This charge arose from foreign exchange contracts
put in place in accordance with our foreign
exchange policy which is approved by our
Supervisory Board. Contracts are put in place to
cover our committed and anticipated exposures in
non-functional currencies. The charge is the sum
of positive and negative results on our hedging
portfolio. The weakening trend of the US dollar-
euro exchange rate in 2007 compared to 2006 was
the main driver for the negative effect on our
financial income and expense line.
We revalue all hedging contracts to market value at
the end of each period, whether or not theyhave
matured, as well as cash and other assets and
liabilities denominated in other currencies than our
functional currency. The 2007 result therefore
consisted of both realised and unrealised results.
As a result of the higher average euro interest rates
and our higher average cash balances, net interest
income increased to €19.1 million compared to
€7.6 million in 2006.
TAXATION
The total income tax charged to our income
statement was €114 million and relates to all
jurisdictions in which we have a fiscal presence.
In absolute terms, the tax charge increased 22%
compared to the previous year (2006: 93 million),
mainlyas a result of higher profits. Our effective tax
rate decreased by 3.1 percentage points to 26.5%
compared to 2006 following the decrease in the
Dutch corporate tax rate from 29.6% to 25.5%.
NET PROFIT
The net profit increased by 43% to €317 million in
2007 from €222 million in 2006.
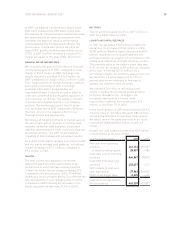
LIQUIDITY AND CAPITAL RESOURCES
In 2007, we generated €535 million of cash from
operations, an increase of €143 million on 2006
(€392 million). Working capital decreased by €29
million, mainly due to increased liabilities and
accruals towards our suppliers in combination with
strong cash collections and tight inventory control.
The inventory value at the balance sheet date was
€131 million, an increase of €8million on the value
at the start of the year (€123 million). As a
percentage of sales, the inventory value at year end
decreased by 1.5 percentage point to 7.5% of
annual sales as we continued to find ways to
operate our inventory more efficiently.
We invested €32 million in technology fixed
assets, including the worldwide patent portfolio
of Horizon Navigation Inc., to support our
worldwide development activities, while
investments in general fixed assets were €17
million, or less than 1% of sales.
In the fourth quarter of 2007 wepurchased a 29.9%
minority stake in Tele Atlas. We spent €816 million,
excluding banking fees, to purchase these shares.
We raised cash in the same period from an equity
issue which delivered €450 million of cash net
of fees.
Overall, our cash balance increased by €26 million
to€463 million at the end of 2007.
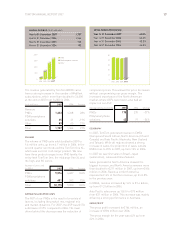
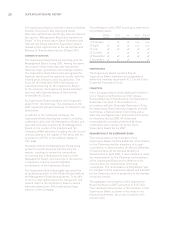
Cash flow (in €thousands) 2007 2006
Net cash from operating
activities 441,113 291,507
of which working capital: 28,957 9,982
Cash flow used in investing
activities -866,567 -28,570
Cash flow from financing
activities 453,417 1,113
Net increase in cash and
cash equivalents 27,963 264,050
Effect of exchange rates -2,425 -4,626
Cash and cash equivalents
at end of period 463,339 437,801
19
TOMTOM ANNUAL REPORT 2007