TomTom 2007 Annual Report Download - page 23
Download and view the complete annual report
Please find page 23 of the 2007 TomTom annual report below. You can navigate through the pages in the report by either clicking on the pages listed below, or by using the keyword search tool below to find specific information within the annual report.-
 1
1 -
2
-
3
-
4
-
5
-
6
-
7
-
8
-
9
-
10
-
11
-
12
-
 13
13 -
 14
14 -
 15
15 -
 16
16 -
 17
17 -
 18
18 -
 19
19 -
 20
20 -
 21
21 -
 22
22 -
 23
23 -
 24
24 -
 25
25 -
 26
26 -
 27
27 -
 28
28 -
 29
29 -
 30
30 -
 31
31 -
 32
32 -
 33
33 -
34
-
35
-
36
-
37
-
38
-
39
-
40
-
41
-
42
-
43
-
44
-
45
-
46
-
47
-
48
-
49
-
50
-
51
-
52
-
53
-
54
-
55
-
56
-
57
-
58
-
59
-
60
-
61
-
62
-
63
-
64
-
65
-
66
-
67
-
68
-
69
-
70
-
71
-
72
-
73
-
74
-
75
-
76
-
77
-
78
-
79
-
80
-
81
-
82
-
83
-
84
-
85
-
86
-
87
-
88
 |
 |

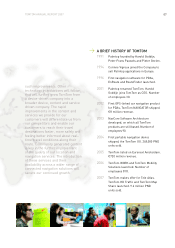
TOMTOM ANNUAL REPORT 2007
The revenue generated by TomTom WORK came
from a strong increase in the number of Webfleet
subscriptions, which more than doubled to 34,000
at the end of 2007 from 14,000 in 2006.
(in €millions) 2007 2006 Change
Revenue
PNDs 1,623 1,268 28%
PDA/smartphone
solutions 25 31 -19%
Other 89 65 37%
Total 1,737 1,364 27%
VOLUMES
The volume of PND units sold doubled in 2007 to
9.6 million units, up from 4.7 million in 2006. In the
second quarter we introduced the TomTom One XL,
which was our first ‘mid-range’ product. We now
havethree product ranges in our PND family: the
entry-level TomTom One, the midrange One XL and
the high-end GO series.
Number of units sold
(in 000s) 2007 2006 Change
PNDs 9,574 4,687 104%
PDA/smartphone
solutions 601 343 75%
Total 10,175 5,030 102%
AVERAGE SELLING PRICE (ASP)
The ASP of our PNDs is the result of a variety of
factors, including the product mix, regional mix
and market dynamics. For 2007, the ASP was €170,
adecrease of 37% compared to 2006. The main
driver behind this decrease was the reduction of
component prices. This allowed for price decreases
without compromising our gross margin. The
increased importance of the North American
market, where ASPs were lower, also had an
impact on our ASP.
Average selling price (in €)2007 2006 Change
PNDs 170 270 -37%
PDA/smartphone
solutions 42 91 -54%
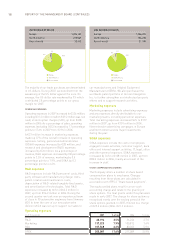
GEOGRAPHY
In 2007, TomTom generated revenue in EMEA
(Europe and South Africa), North America (US and
Canada) and Asia Pacific (Australia, New Zealand
and Taiwan). While all regions showed a strong
increase in sales, the proportion of sales outside
EMEA rose to 20% in 2007, up from 10% in 2006.
In 2007 we saw first sales in Brazil, Japan
(automotive), Latvia and New Zealand.
Sales generated in North America showed the
biggestincrease, and North America revenue more
than doubled to €271 million in 2007, up from €106
million in 2006. Revenue in North America
represented 16% of TomTom revenue, up from 8%
in the previous year.
In EMEA, revenue increased by 14% to €1.4 billion,
up from €1.2 billion in 2006.
Asia Pacific sales wereup 126% to€70 million
from €31 million in 2006. This increase was mainly
driven by a strong performance in Australia.
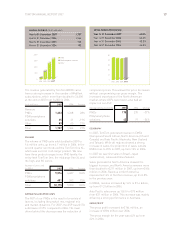
GROSSPROFIT
The gross profit increased to €764 million, an
increase of €186 million over 2006.
The gross margin for the year was 44% up from
42% in 2006.
17
0
500
1,000
1,500
2,000
2004
PNDs
PDA/smartphone solutions
Other
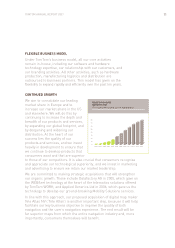
2005 2006 2007
ANNUAL REVENUE (in €millions)
Year to 31 December 2007 1,737
Year to 31 December 2006 1,364
Year to 31 December 2005 720
Year to 31 December 2004 192
2005 2006 20072004
0
10
20
30
40
50
GROSS MARGIN PERCENTAGE
Year to 31 December 2007 44.0%
Year to 31 December 2006 42.4%
Year to 31 December 2005 43.2%
Year to 31 December 2004 44.3%