Tesco 2007 Annual Report Download - page 11
Download and view the complete annual report
Please find page 11 of the 2007 Tesco annual report below. You can navigate through the pages in the report by either clicking on the pages listed below, or by using the keyword search tool below to find specific information within the annual report.-
 1
1 -
 2
2 -
 3
3 -
 4
4 -
 5
5 -
 6
6 -
 7
7 -
 8
8 -
 9
9 -
 10
10 -
 11
11 -
 12
12 -
 13
13 -
 14
14 -
 15
15 -
 16
16 -
 17
17 -
 18
18 -
 19
19 -
 20
20 -
 21
21 -
 22
22 -
23
-
24
-
25
-
26
-
27
-
28
-
29
-
30
-
31
-
32
-
33
-
34
-
35
-
36
-
37
-
38
-
39
-
40
-
41
-
42
-
43
-
44
-
45
-
46
-
47
-
48
-
49
-
50
-
51
-
52
-
53
-
54
-
55
-
56
-
57
-
58
-
59
-
60
-
61
-
62
-
63
-
64
-
65
-
66
-
67
-
68
-
69
-
70
-
71
-
72
-
73
-
74
-
75
-
76
-
77
-
78
-
79
-
80
-
81
-
82
-
83
-
84
-
85
-
86
-
87
-
88
-
89
-
90
-
91
-
92
-
93
-
94
-
95
-
96
-
97
-
98
-
99
-
100
-
101
-
102
-
103
-
104
-
105
-
106
-
107
-
108
-
109
-
110
-
111
-
112
 |
 |

9
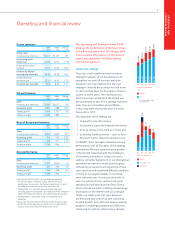
OPERATING AND
FINANCIAL REVIEW
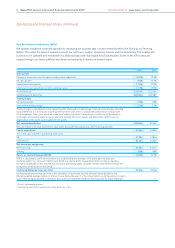
2007 2006
Total shareholder return 36.0% 45.8%
Total shareholder return is the notional return from a share and is measured as the percentage change in the share
price, plus the dividend paid. This is measured over the last five years.
Full year dividend per share 9.64p 8.63p
The growth of the dividend per share from one period to the next is important to shareholders since this represents
their actual cash return, and is usually paid twice a year.
We monitor a wide range of KPIs, both financial and non-financial. Across the Group, KPIs are set locally, with oversight from the
Executive Directors, to ensure they are tailored to drive the priorities of each business. Each business operates a Steering Wheel, our
balanced scorecard. During the last year we have made good progress with rolling-out our Corporate Responsibility management
system to our International operations. We report quarterly on social, ethical and environmental matters alongside their Customer,
Operations, Finance and People KPIs. More detail on each country follows in the ‘Operations, resources and relationships’ section.
The following are some KPIs for the UK and Group operations.
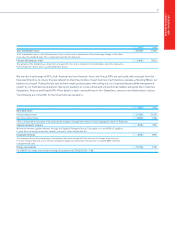
2007 2006
UK market share
Grocery market share* 21.0% 20.2%
Non-food market share 8.0% 7.0%
*This is measured as the share of all spend by all shoppers through Taylor Nelson Sofres Superpanel (Total Till Roll) data.
Supplier viewpoint measure 94% 94%
We aim to monitor supplier relations through the Supplier Viewpoint Survey. The target is for over 90% of suppliers
to view Tesco as being trustworthy, reliable, consistent, clear, helpful and fair.
Employee retention 84% 83%
This measure shows the percentage of employees who have stayed with the business for longer than one year.
It is one measure that we use to monitor employee loyalty and satisfaction and we aim to exceed 80% retention
of experienced staff.
Energy consumption 12.5% 5.5%
For 2006/07 our target was to reduce energy consumption by 12% (2005/06 – 5%).