Tesco 2006 Annual Report Download - page 8
Download and view the complete annual report
Please find page 8 of the 2006 Tesco annual report below. You can navigate through the pages in the report by either clicking on the pages listed below, or by using the keyword search tool below to find specific information within the annual report.-
 1
1 -
 2
2 -
 3
3 -
 4
4 -
 5
5 -
 6
6 -
 7
7 -
 8
8 -
 9
9 -
 10
10 -
 11
11 -
 12
12 -
 13
13 -
 14
14 -
 15
15 -
 16
16 -
 17
17 -
 18
18 -
 19
19 -
20
-
21
-
22
-
23
-
24
-
25
-
26
-
27
-
28
-
29
-
30
-
31
-
32
-
33
-
34
-
35
-
36
-
37
-
38
-
39
-
40
-
41
-
42
-
43
-
44
-
45
-
46
-
47
-
48
-
49
-
50
-
51
-
52
-
53
-
54
-
55
-
56
-
57
-
58
-
59
-
60
-
61
-
62
-
63
-
64
-
65
-
66
-
67
-
68
-
69
-
70
-
71
-
72
-
73
-
74
-
75
-
76
-
77
-
78
-
79
-
80
-
81
-
82
-
83
-
84
-
85
-
86
-
87
-
88
-
89
-
90
-
91
-
92
-
93
-
94
-
95
-
96
-
97
-
98
-
99
-
100
-
101
-
102
-
103
-
104
-
105
-
106
-
107
-
108
-
109
-
110
-
111
-
112
-
113
-
114
-
115
-
116
 |
 |

6 Tesco plc
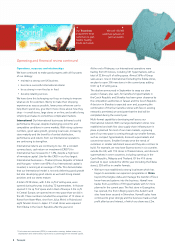
4
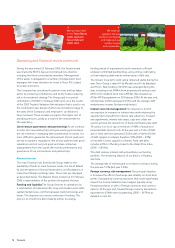
This year we opened
a161,000 sq ft
state-of-the-art
fresh food depot
in Teresin, Poland.
4
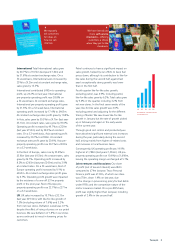
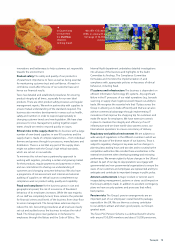
Internationally we have
substantial, successful,
local businesses, such
as our Hymall joint
venture in China.
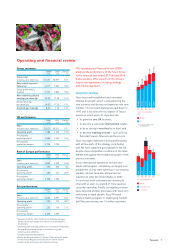
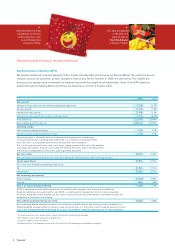
Operating and financial review continued
2006* 2005†
Sales growth
Change in Group sales over the year (including value added tax) 13.2% 12.4%
UK sales growth 10.7% 11.9%
International sales growth 23.0% 13.1%
International sales growth (at constant exchange rates) 15.5% 18.3%
Profit before tax £2,210m £1,894m
New underlying profit before tax £2,251m £1,925m
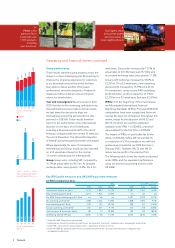
Operating margin
UK pre-property operating margin 5.7% 5.7%
International pre-property operating margin 5.7% 5.5%
Operating margin is calculated from the operating profit expressed as a percentage
of Group revenue (sales excluding value added tax). It is a measure of profit generation
from sales and is a comparable performance measure with other companies.
This is how much we made from trade in our stores, taking account of the cost of the products
sold, wages and salaries, expenses associated with running the stores, depots and head office,
and the cost of depreciation of the assets used to generate the profits.
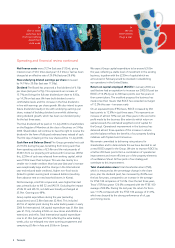
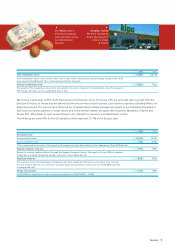
Net cash inflow#£165m £24m
Net cash inflow is the cash received less cash spent during the financial period, after financing activities.
Capital expenditure#£2.8bn £2.4bn
This is the cash invested in purchasing fixed assets.
UK £1.8bn £1.7bn
International £1.0bn £0.7bn
Net borrowings and gearing#
Net borrowings £4.5bn‡£3.9bn
Gearing 48% 43%
Return on Capital Employed (ROCE) 12.6% 11.5%
ROCE is calculated as profit before interest less tax divided by the average of net assets plus net debt plus
dividend creditor less net assets held for sale. ROCE is a relative profit measurement that not only incorporates
the funds shareholdershave invested, but also funds invested by banks and other lenders, and therefore shows the
productivity of the assets of the Group.
New underlying diluted earnings per share20.06p 17.58p
New underlying diluted earnings per share is the calculation of profit after tax and minority interest divided by the
diluted weighted average number of shares in issue during the year. It is the amount which could be paid out on each
share if the Company decided to distribute all its profits as dividends instead of retaining some for future expansion.
*52-week comparison basis (except where stated) and excluding discontinuing operation.
#60-week basis and excluding discontinuing operation.
†Growth on 2004 52-weeks pro forma.
‡Excluding the first time adoption impact of IAS 32 and IAS 39, net borrowings were broadly unchanged.
Key Performance Indicators (KPIs)
Weoperate a balanced scorecard approach that is known internally within the Group as our Steering Wheel. This unites the Group’s
resources around our customers, people, operations, finance and, for the first time in 2006, the community. This enables the
business to be operated and monitored on a balanced basis with due regard for all stakeholders. Some of the KPIs below are
tracked through our Steering Wheel and others are tracked as a monitor of investor return.