Tesco 2006 Annual Report Download - page 72
Download and view the complete annual report
Please find page 72 of the 2006 Tesco annual report below. You can navigate through the pages in the report by either clicking on the pages listed below, or by using the keyword search tool below to find specific information within the annual report.-
 1
1 -
2
-
3
-
4
-
5
-
6
-
7
-
8
-
9
-
10
-
11
-
12
-
13
-
14
-
15
-
16
-
17
-
18
-
19
-
20
-
21
-
22
-
23
-
24
-
25
-
26
-
27
-
28
-
29
-
30
-
31
-
32
-
33
-
34
-
35
-
36
-
37
-
38
-
39
-
40
-
41
-
42
-
43
-
44
-
45
-
46
-
47
-
48
-
49
-
50
-
51
-
52
-
53
-
54
-
55
-
56
-
57
-
58
-
59
-
60
-
61
-
 62
62 -
 63
63 -
 64
64 -
 65
65 -
 66
66 -
 67
67 -
 68
68 -
 69
69 -
 70
70 -
 71
71 -
 72
72 -
 73
73 -
 74
74 -
 75
75 -
 76
76 -
 77
77 -
 78
78 -
 79
79 -
 80
80 -
 81
81 -
 82
82 -
83
-
84
-
85
-
86
-
87
-
88
-
89
-
90
-
91
-
92
-
93
-
94
-
95
-
96
-
97
-
98
-
99
-
100
-
101
-
102
-
103
-
104
-
105
-
106
-
107
-
108
-
109
-
110
-
111
-
112
-
113
-
114
-
115
-
116
 |
 |

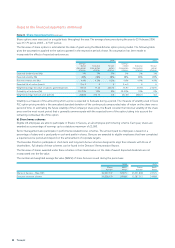
70 Tesco plc
Notes to the financial statements continued
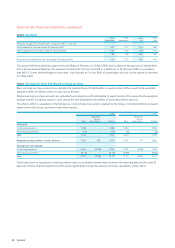
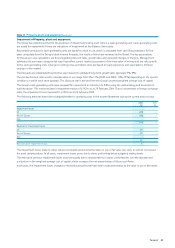
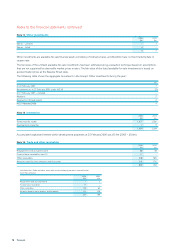
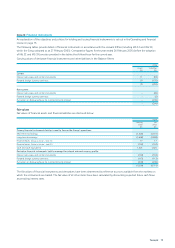
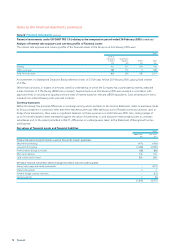
Note 14 Other investments
2006 2005
£m£m
Shares – unlisted –7
Shares – listed 4–
47
Other investments are available-for-sale financial assets consisting of ordinary shares, and therefore have no fixed maturity date or
coupon rate.
The fair value of the unlisted available-for-sale investments has been estimated using a valuation technique based on assumptions
that are not supported by observable market prices or rates. The fair value of the listed available-for-sale investments is based on
quoted market prices at the Balance Sheet date.
The following table shows the aggregate movement in the Group’s Other investments during the year:
£m
At 26 February 2005 7
Restatement as at 27 February 2005 under IAS 39 (7)
At 27 February 2005 – restated –
Additions 2
Revaluation through equity 2
At 25 February 2006 4
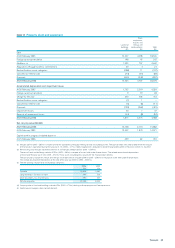
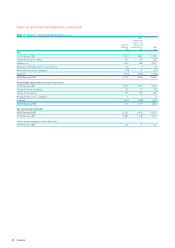
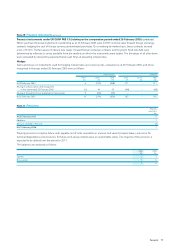
Note15 Inventories
2006 2005
£m £m
Goods held for resale 1,457 1,306
Development properties 73
1,464 1,309
Accumulated capitalised interest within development properties at 25 February 2006 was £0.4m (2005 – £0.6m).
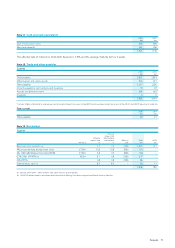
Note 16 Trade and other receivables
2006 2005
£m £m
Prepayments and accrued income 86 48
Finance lease receivables (note 31) 17 –
Other receivables 648 585
Amounts owed by Joint ventures and Associates 141 136
892 769
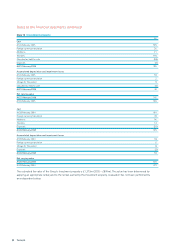
Included within Trade and other receivables are the following amounts receivable after
more than one year:
2006 2005
£m £m
Prepayments and accrued income – 2
Financelease receivables 11 –
Other receivables 118 60
Amounts owed by Joint ventures and Associates 121 126
250 188