Tesco 2006 Annual Report Download - page 73
Download and view the complete annual report
Please find page 73 of the 2006 Tesco annual report below. You can navigate through the pages in the report by either clicking on the pages listed below, or by using the keyword search tool below to find specific information within the annual report.-
 1
1 -
2
-
3
-
4
-
5
-
6
-
7
-
8
-
9
-
10
-
11
-
12
-
13
-
14
-
15
-
16
-
17
-
18
-
19
-
20
-
21
-
22
-
23
-
24
-
25
-
26
-
27
-
28
-
29
-
30
-
31
-
32
-
33
-
34
-
35
-
36
-
37
-
38
-
39
-
40
-
41
-
42
-
43
-
44
-
45
-
46
-
47
-
48
-
49
-
50
-
51
-
52
-
53
-
54
-
55
-
56
-
57
-
58
-
59
-
60
-
61
-
62
-
 63
63 -
 64
64 -
 65
65 -
 66
66 -
 67
67 -
 68
68 -
 69
69 -
 70
70 -
 71
71 -
 72
72 -
 73
73 -
 74
74 -
 75
75 -
 76
76 -
 77
77 -
 78
78 -
 79
79 -
 80
80 -
 81
81 -
 82
82 -
 83
83 -
84
-
85
-
86
-
87
-
88
-
89
-
90
-
91
-
92
-
93
-
94
-
95
-
96
-
97
-
98
-
99
-
100
-
101
-
102
-
103
-
104
-
105
-
106
-
107
-
108
-
109
-
110
-
111
-
112
-
113
-
114
-
115
-
116
 |
 |

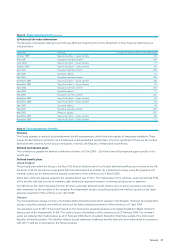
71Tesco plc
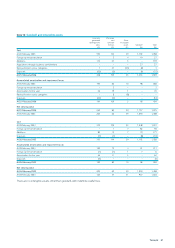
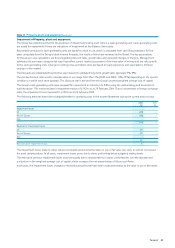
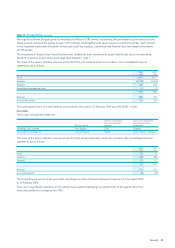
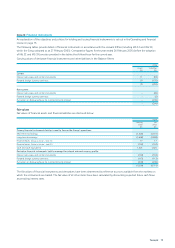
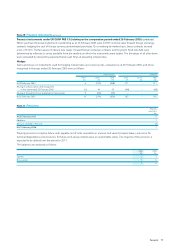
Note 17 Cash and cash equivalents
2006 2005
£m £m
Cash at bank and in hand 964 800
Short-term deposits 361 346
1,325 1,146
The effective rate of interest on short-term deposits is 3.9% and the average maturity term is 2 weeks.
Note 18 Trade and other payables
Current
2006 2005
£m£m
Trade payables 2,832 2,819
Other taxation and social security 216 221
Other payables 1,257 1,236
Amounts payable to Joint ventures and Associates 79 29
Accruals and deferred income 693 663*
Dividends 66
5,083 4,974
*Includes £163m attributable to realised gains on terminated interest rate swaps. Under IFRS these have been reclassified as part of the IAS 32 and IAS 39 adjustments (note 33).
Non-current
2006 2005
£m £m
Other payables 29 21
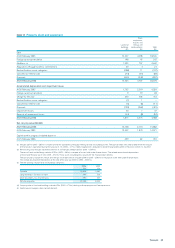
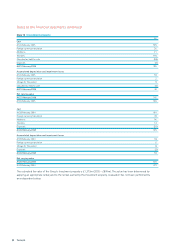
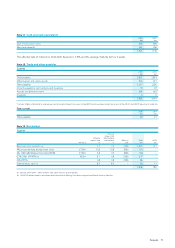
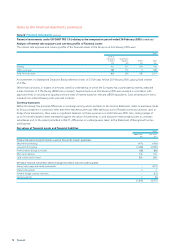
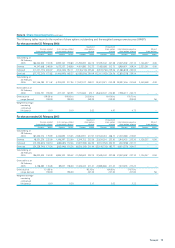
Note19 Borrowings
Current
Effective
interest rate
Effective after hedging
interest rate transactions Maturity 2006 2005
Par value % % year £m £m
Bank loans and overdrafts (a) 4.5 4.5 2006 1,013 471
4% unsecured deep discount loan stock £125m 10.2 10.8 2006 122 –
6% 150m GBP Medium Term Note (MTN) £150m 6.0 4.9 2006 158 –
0.7% 50bn JPY MTN (b) ¥50bn 0.7 4.8 2006 247 –
Other MTNs 4.8 4.8 2006 86 –
Finance leases (note 31) 8.3 8.3 – 20 11
1,646 482
(a) Includes £9m (2005 – £9m) of loans from Joint ventures and Associates.
(b) The MTNs denominated in currencies other than Pounds Sterling have been swapped into Pounds Sterling liabilities.