Tesco 2006 Annual Report Download - page 2
Download and view the complete annual report
Please find page 2 of the 2006 Tesco annual report below. You can navigate through the pages in the report by either clicking on the pages listed below, or by using the keyword search tool below to find specific information within the annual report.-
 1
1 -
 2
2 -
 3
3 -
 4
4 -
 5
5 -
 6
6 -
 7
7 -
 8
8 -
 9
9 -
 10
10 -
 11
11 -
 12
12 -
 13
13 -
14
-
15
-
16
-
17
-
18
-
19
-
20
-
21
-
22
-
23
-
24
-
25
-
26
-
27
-
28
-
29
-
30
-
31
-
32
-
33
-
34
-
35
-
36
-
37
-
38
-
39
-
40
-
41
-
42
-
43
-
44
-
45
-
46
-
47
-
48
-
49
-
50
-
51
-
52
-
53
-
54
-
55
-
56
-
57
-
58
-
59
-
60
-
61
-
62
-
63
-
64
-
65
-
66
-
67
-
68
-
69
-
70
-
71
-
72
-
73
-
74
-
75
-
76
-
77
-
78
-
79
-
80
-
81
-
82
-
83
-
84
-
85
-
86
-
87
-
88
-
89
-
90
-
91
-
92
-
93
-
94
-
95
-
96
-
97
-
98
-
99
-
100
-
101
-
102
-
103
-
104
-
105
-
106
-
107
-
108
-
109
-
110
-
111
-
112
-
113
-
114
-
115
-
116
 |
 |

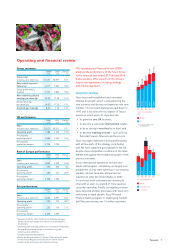
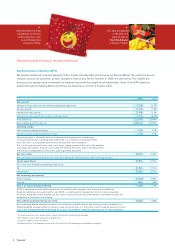
13.2%
Group sales
2006 2006 2005
Continuing operations 60 weeksø52 weeks* 52 weeks
Group sales (£m)
(including value added tax) 43,137 41,819 36,957
Group revenue (£m) 39,454 38,259 33,866
New underlying Group profit before tax†(£m) 2,277 2,251 1,925
Group profit before tax (£m) 2,235 2,210 1,894
New underlying diluted earnings per share†(p) 20.30 20.06 17.58
Diluted earnings per share(p) 19.92 19.70 17.30
Dividend per share(p) 8.63 –7.56
Group enterprise value (£m)
(market capitalisation plus net debt) 30,841 – 27,910
Return on capital employed (ROCE) 12.7% 12.6% 11.8%
Non-GAAP measure: new underlying profit £m £m
Profit before tax (excluding discontinuing operation) 2,235 1,894
Adjustments for:
IAS 32 and IAS 39 9–
Total IAS 19 Income Statement charge 303 268
‘Normal’ cash contribution for pensions (270) (237)
New underlying Group profit before tax 2,277 1,925
* 52-week comparison basis and excludes discontinuing operation.
†Adjusted for IAS 32, IAS 39 and the net difference between the IAS 19 pension charge
and ‘normal’ cash contributions for pensions.
øResults for the year ended 25 February 2006 includes 52 weeks for the UK and Republic of Ireland and 14 months
for the majority of the remaining International businesses, and excludes discontinuing operation.
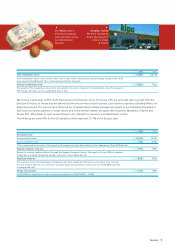
1Operating and financial review 18 Directors’ report 20 Corporate governance 25 Directors’ remuneration report
40 Statement of directors’ responsibilities 41 Independent auditors’ report 42 Group income statement
43 Group statement of recognised income and expense 44 Group balance sheet 45 Group cash flow statement
46 Notes to the financial statements 102 Five year record 104 Parent company financial statements
FINANCIAL HIGHLIGHTS GROWTH ON 2005*
16.9%
New underlying
Group profit
before tax†
16.7%
Group profit
before tax
14.1%
New underlying
diluted earnings
per share†
13.9%
Diluted earnings
per share
14.2%
Dividend
per share