Tesco 2005 Annual Report Download - page 62
Download and view the complete annual report
Please find page 62 of the 2005 Tesco annual report below. You can navigate through the pages in the report by either clicking on the pages listed below, or by using the keyword search tool below to find specific information within the annual report.-
 1
1 -
2
-
3
-
4
-
5
-
6
-
7
-
8
-
9
-
10
-
11
-
12
-
13
-
14
-
15
-
16
-
17
-
18
-
19
-
20
-
21
-
22
-
23
-
24
-
25
-
26
-
27
-
28
-
29
-
30
-
31
-
32
-
33
-
34
-
35
-
36
-
37
-
38
-
39
-
40
-
41
-
42
-
43
-
44
-
45
-
46
-
47
-
48
-
49
-
50
-
51
-
 52
52 -
 53
53 -
 54
54 -
 55
55 -
 56
56 -
 57
57 -
 58
58 -
 59
59 -
 60
60 -
 61
61 -
 62
62 -
 63
63 -
 64
64 -
 65
65 -
 66
66 -
 67
67 -
 68
68
 |
 |

60 Tesco PLC
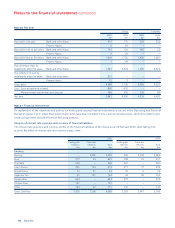
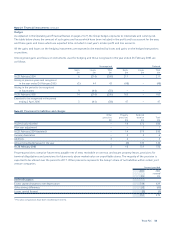
Notes to the financial statements continued
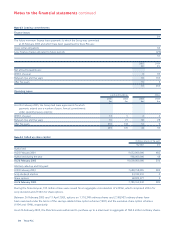
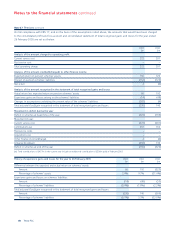
Note 27 Pensions continued
On full compliance with FRS 17, and on the basis of the assumptions noted above, the amounts that would have been charged
to the consolidated profit and loss account and consolidated statement of total recognised gains and losses for the year ended
26 February 2005 are set out below:
2005 2004
£m £m
Analysis of the amount charged to operating profit
Current service cost 272 201
Past service cost ––
Total operating charge 272 201
Analysis of the amount credited/(charged) to other finance income
Expected return on pension schemes’ assets 156 120
Interest on pension schemes’ liabilities (152) (126)
Net return 4 (6)
Analysis of the amount recognised in the statement of total recognised gains and losses
Actual return less expected return on pension schemes’ assets 66 192
Experience gains and losses arising on the schemes’ liabilities (14) (48)
Changes in assumptions underlying the present value of the schemes’ liabilities (282) (4)
Total actuarial (loss)/gain recognised in the statement of total recognised gains and losses (230) 140
Movement in deficit during the year
Deficit in schemes at beginning of the year (674) (769)
Movement in year:
Current service cost (272) (201)
Contributions (a) 437 162
Past service costs ––
Acquisition cost ––
Other finance income/(charge) 4 (6)
Actuarial (loss)/gain (230) 140
Deficit in schemes at end of the year (735) (674)
(a) Total contributions of £437m in the current year include an additional contribution of £200m paid in February 2005.
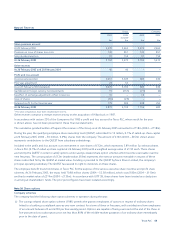
History of experience gains and losses for the year to 26 February 2005 2005 2004 2003
£m £m £m
Difference between the expected and actual return on schemes’ assets:
Amount 66 192 (323)
Percentage of schemes’ assets 2.4% 9.7% (21.4%)
Experience gains and losses on schemes’ liabilities:
Amount (14) (48) (53)
Percentage of schemes’ liabilities (0.4%) (1.8%) (2.3%)
Total actuarial (loss)/gain recognised in the statement of total recognised gains and losses:
Amount (230) 140 (569)
Percentage of schemes’ liabilities (6.7%) 5.3% (25.0%)