Tesco 2005 Annual Report Download - page 5
Download and view the complete annual report
Please find page 5 of the 2005 Tesco annual report below. You can navigate through the pages in the report by either clicking on the pages listed below, or by using the keyword search tool below to find specific information within the annual report.-
 1
1 -
 2
2 -
 3
3 -
 4
4 -
 5
5 -
 6
6 -
 7
7 -
 8
8 -
 9
9 -
 10
10 -
 11
11 -
 12
12 -
 13
13 -
 14
14 -
 15
15 -
 16
16 -
17
-
18
-
19
-
20
-
21
-
22
-
23
-
24
-
25
-
26
-
27
-
28
-
29
-
30
-
31
-
32
-
33
-
34
-
35
-
36
-
37
-
38
-
39
-
40
-
41
-
42
-
43
-
44
-
45
-
46
-
47
-
48
-
49
-
50
-
51
-
52
-
53
-
54
-
55
-
56
-
57
-
58
-
59
-
60
-
61
-
62
-
63
-
64
-
65
-
66
-
67
-
68
 |
 |

During the second half, like-for-like sales
increased by 9.5% including petrol and by
7.4%, excluding petrol.
UK underlying operating profit was 11.0%
higher at £1,694m (2004 – £1,526m). The
operating margin was maintained at 6.2%.
International Total international sales grew by
13.1% to £7.6bn and by 18.3% at constant
exchange rates. International operations
contributed £370m to underlying operating
profit, up 20.9% on last year, with operating
margins rising to 5.4% (2004 – 5.1%). At
constant exchange rates, international profit
grew by 26.5%.
In the Rest of Europe, sales rose by 13.4% to
£4.3bn (2004 – £3.8bn). At constant exchange
rates, sales grew by 15.7%. Underlying operating
profit increased by 18.5% to £218m (2004 –
£184m). In Asia, sales grew by 12.8% to £3.2bn
(2004 – £2.8bn). At constant exchange rates,
sales grew by 21.8%. Underlying operating profit
increased by 24.6% to £152m (2004 – £122m).
Joint Ventures and Associates Our total share
of profit (excluding goodwill amortisation) for
the year was £135m compared to £99m last
year. Tesco Personal Finance pre-tax profit post
minority interest was £202m, of which our share
was £101m, up 26.5% on last year.
Net interest payable was £170m (2004 – £223m),
giving cover of 12.5 times (2004 – 8.2 times). Tax
has been charged at an effective rate of 30.2%
(2004 – 31.1%). Prior to accounting for the net
profit on disposal of fixed assets, resulting mainly
from the property joint venture with Topland
announced in March 2004, as well as goodwill
amortisation and integration costs, our
underlying tax rate was 29.5% (2004 – 29.5%).
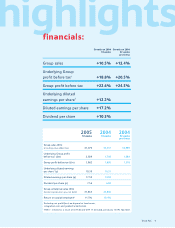
Underlying diluted earnings per share increased
by 12.2% to 18.30p (2004 – 16.31p).
Cash Flow and Balance Sheet The Group
generated net cash of £121m during the year,
benefiting from a strong operating cash inflow of
£3bn, after an additional £200m contribution to
the Group pension scheme and the net proceeds
of £646m from our property joint venture with
Topland. Net debt reduced to £3.8bn at the year
end, representing gearing of 43% (2004 – 51%).
After year end we generated around £350m
from our most recent property joint venture with
the Consensus Business Group.
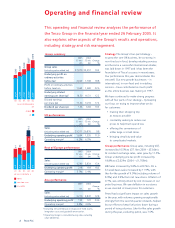
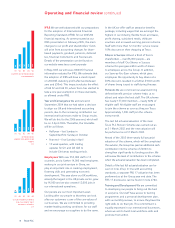
Group capital expenditure during the year
(excluding acquisitions but including the ten
Safeway stores purchased from Morrisons) was
£2.4bn (2004 – £2.3bn). We expect Group capital
expenditure to be around £2.4bn this year. UK
capital expenditure was £1.7bn (2004 – £1.5bn),
including £835m on new stores and £288m on
extensions and refits. Total international capital
expenditure was £746m (2004 – £765m)
comprising £282m in Asia and £464m in Europe.
Dividends The Board has proposed a final
dividend of 5.27p per share (2004 – 4.77p). This
represents an increase of 10.5%. Together with
the interim dividend of 2.29p (2004 – 2.07p)
already paid, this brings the full year dividend
to 7.56p, also an increase of 10.5% on last year.
The final dividend will be paid on 1 July 2005 to
shareholders on the Register of Members at the
close of business on 22 April 2005. Shareholders
will continue to have the right to receive the
dividend in the form of fully paid ordinary shares
instead of cash. The first day of dealing in the
new shares will be 1 July 2005.
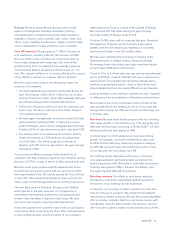
Total Shareholder Return Total Shareholder
Returns (TSR), which is measured as the
percentage change in the share price, plus the
dividend paid, has increased by 108.7% over
the last five years, compared to the decrease
in the FTSE 100 average of 6.2%. Over the
last three years, Tesco TSR has been 34.5%,
compared to the FTSE 100 average of 8.8%.
In the last year, the return in Tesco was 25.1%,
compared to the FTSE 100 average of 15.0%.
Return on Capital Employed (ROCE). At the time
of our share placing in January 2004, we believed
we could increase our 2002/03 financial year post
tax ROCE of 10.2% by up to 200 basis points
over five years based on then current plans. The
excellent progress we have made in the year,
combined with the effect of the Topland property
funding initiative, means that post tax ROCE rose
to 11.5%.
Tesco PLC 3
01 02 0403
CAPITAL EXPENDITURE
£m
2,134
2,027
1,944
1,228
2,285 1,520
05
2,417 1,671
1,276
1,206
GROUP
UK
1 year 3 years 5 years
TOTAL SHAREHOLDER RETURN
RELATIVE TO THE FTSE 100
114.9
25.7
10.1
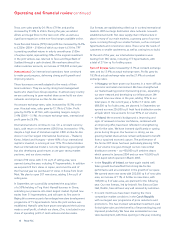
01 0302
UK SALES AREA OPENED
000 s
q
ft
1,433
04
1,778
05
1,519
1,296
1,298