Tesco 2005 Annual Report Download - page 47
Download and view the complete annual report
Please find page 47 of the 2005 Tesco annual report below. You can navigate through the pages in the report by either clicking on the pages listed below, or by using the keyword search tool below to find specific information within the annual report.-
 1
1 -
2
-
3
-
4
-
5
-
6
-
7
-
8
-
9
-
10
-
11
-
12
-
13
-
14
-
15
-
16
-
17
-
18
-
19
-
20
-
21
-
22
-
23
-
24
-
25
-
26
-
27
-
28
-
29
-
30
-
31
-
32
-
33
-
34
-
35
-
36
-
 37
37 -
 38
38 -
 39
39 -
 40
40 -
 41
41 -
 42
42 -
 43
43 -
 44
44 -
 45
45 -
 46
46 -
 47
47 -
 48
48 -
 49
49 -
 50
50 -
 51
51 -
 52
52 -
 53
53 -
 54
54 -
 55
55 -
 56
56 -
 57
57 -
58
-
59
-
60
-
61
-
62
-
63
-
64
-
65
-
66
-
67
-
68
 |
 |

Tesco PLC 45
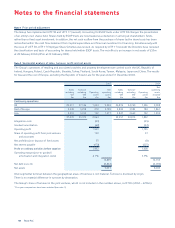
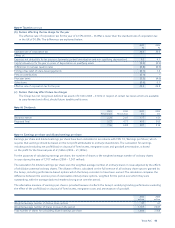
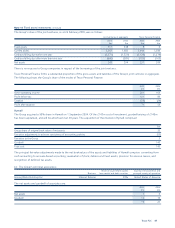
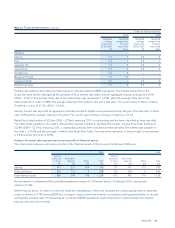
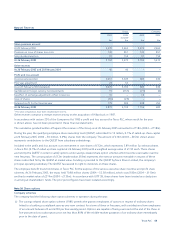
Note 13 Tangible fixed assets continued
(a) Includes £63m in respect of interest capitalised, principally relating to land and building assets. The capitalisation rate used to determine the amount
of finance costs capitalised during the period was 5.7%. Interest capitalised is deducted in determining taxable profit in the period in which it is incurred.
(b) Net book value includes capitalised interest at 26 February 2005 of £597m (2004 – £540m).
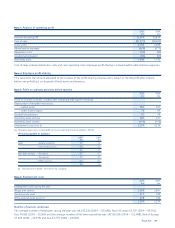
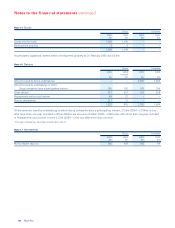
The cost of Land and buildings includes £16m (2004 – nil) in respect of assets held under finance leases. The related accumulated depreciation
at the end of the year was £0.1m (2004 – nil).
The cost of Plant, equipment, fixtures and fittings and motor vehicles includes £397m (2004 – £842m) in respect of assets held under finance leases.
The related accumulated depreciation at the end of the year was £358m (2004 – £572m).
(c) The net book value of land and buildings comprises:
2005 2004
£m £m
Freehold 12,070 11,023
Long leasehold – 50 years or more 552 501
Short leasehold – less than 50 years 553 485
At 26 February 2005 13,175 12,009
(d) Capital work in progress does not include land.
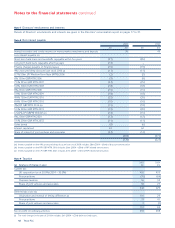
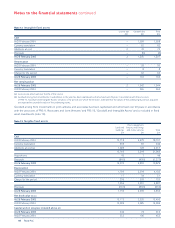
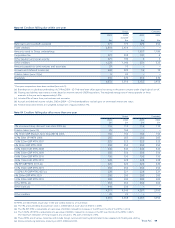
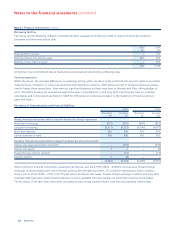
Note 14 Fixed asset investments
Group Company
Shares in Loans to
Joint Own Other Group Group Joint
ventures(b) Associates(c) shares investments undertakings undertakings ventures
£m £m £m £m £m £m £m
As previously reported 309 21 28 6 5,524 3,553 143
Restatement (i) – – (28) – – – –
At 28 February 2004 (restated) 309 21 – 6 5,524 3,553 143
Additions (ii) 148 5 – 1 382 258 2
Effect of foreign exchange
rate changes (5) (3) –––––
Share of profit/(loss) of joint
ventures and associates 72 (3) –––––
Transfer to provisions (iii) 3––––––
Goodwill amortisation (4) (1) –––––
Income received from joint
ventures and associates (135) ––––––
Disposals ––––(9)(287) –
At 26 February 2005 388 19 – 7 5,897 3,524 145
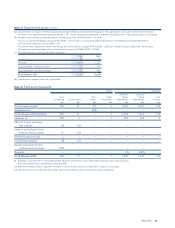
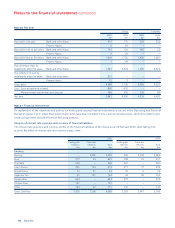
(i) Restated in line with UITF 17 (revised) and UITF 38 (note 1). The Own shares held by the employee share ownership trust
are now included within shareholders’ funds (note 25).
(ii) Additions includes £140m of goodwill in respect of Joint ventures and £1m of goodwill in respect of Associates.
(iii) Transfer to provisions represents the Group’s share of net liabilities within certain joint venture companies.