TD Bank 2011 Annual Report Download - page 4
Download and view the complete annual report
Please find page 4 of the 2011 TD Bank annual report below. You can navigate through the pages in the report by either clicking on the pages listed below, or by using the keyword search tool below to find specific information within the annual report.-
 1
1 -
 2
2 -
 3
3 -
 4
4 -
 5
5 -
 6
6 -
 7
7 -
 8
8 -
 9
9 -
 10
10 -
 11
11 -
 12
12 -
 13
13 -
 14
14 -
 15
15 -
16
-
17
-
18
-
19
-
20
-
21
-
22
-
23
-
24
-
25
-
26
-
27
-
28
-
29
-
30
-
31
-
32
-
33
-
34
-
35
-
36
-
37
-
38
-
39
-
40
-
41
-
42
-
43
-
44
-
45
-
46
-
47
-
48
-
49
-
50
-
51
-
52
-
53
-
54
-
55
-
56
-
57
-
58
-
59
-
60
-
61
-
62
-
63
-
64
-
65
-
66
-
67
-
68
-
69
-
70
-
71
-
72
-
73
-
74
-
75
-
76
-
77
-
78
-
79
-
80
-
81
-
82
-
83
-
84
-
85
-
86
-
87
-
88
-
89
-
90
-
91
-
92
-
93
-
94
-
95
-
96
-
97
-
98
-
99
-
100
-
101
-
102
-
103
-
104
-
105
-
106
-
107
-
108
-
109
-
110
-
111
-
112
-
113
-
114
-
115
-
116
-
117
-
118
-
119
-
120
-
121
-
122
-
123
-
124
-
125
-
126
-
127
-
128
-
129
-
130
-
131
-
132
-
133
-
134
-
135
-
136
-
137
-
138
-
139
-
140
-
141
-
142
-
143
-
144
-
145
-
146
-
147
-
148
-
149
-
150
-
151
-
152
-
153
-
154
-
155
-
156
-
157
-
158
-
159
-
160
-
161
-
162
-
163
-
164
 |
 |

2TD BANK GROUP ANNUAL REPORT 2011 YEAR AT A GLANCE
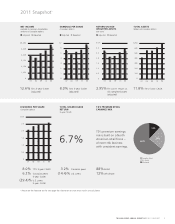
Key Financial Metrics
(millions of Canadian dollars, except where noted) 2011 2010 2009
Results of operations
Total revenues – reported $ 21,594 $ 19,565 $ 17,860
Total revenues – adjusted 21,418 19,563 18,621
Net income – reported 5,889 4,644 3,120
Net income – adjusted 6,251 5,228 4,716
Financial positions at year-end
Total assets 686,360 619,545 557,219
Total deposits 481,114 429,971 391,034
Total loans 305,808 272,162 255,496
Per common share (Canadian dollars)
Diluted earnings – reported 6.41 5.10 3.47
Diluted earnings – adjusted 6.82 5.77 5.35
Dividend payout ratio – adjusted 38.1% 42.1% 45.6%
Closing market price (Oct. 31, 2011) 75.23 73.45 61.68
Total shareholder return 5.7% 23.4% 13.6%
Financial ratios
Tier 1 capital ratio 13.0% 12.2% 11.3%
Total capital ratio 16.0% 15.5% 14.9%
Efficiency ratio – reported 60.6% 62.2% 68.4%
Efficiency ratio – adjusted 57.9% 58.6% 59.2%
1
Results prepared in accordance with GAAP are referred to as “reported.” Adjusted
results (excluding “items of note,” net of tax, from reported results) and related
terms are not defined terms under GAAP and, therefore, may not be comparable
to similar terms used by other issuers.
See “How the Bank Reports” in the accompanying Management’s Discussion and
Analysis for further explanation, a list of the items of note and reconciliation of
non-GAAP financial measures.
“ Five-year CAGR” is the compound annual growth rate calculated from 2006 to
2011 on an adjusted basis.
“TD’s Premium Retail Earnings Mix” is based on adjusted results.
“ Canadian Retail” earnings are the total adjusted earnings of the Canadian
Personal and Commercial Banking and Wealth Management segments.
“U.S. Retail” earnings are the total adjusted earnings of U.S. Personal
and Commercial Banking segment and AMTD pickup.
Canadian peers / Big Five Retail Banks include Royal Bank of Canada, Scotiabank,
Bank of Montreal and Canadian Imperial Bank of Commerce.
U.S. peers include Citigroup, Bank of America, J.P. Morgan, Wells Fargo,
PNC Financial and U.S. Bancorp.
For purposes of comparison with U.S. peers, dividends per share five-year
compound growth rate is calculated on a year-to-date basis from Q3 2006
to Q3 2011.
2
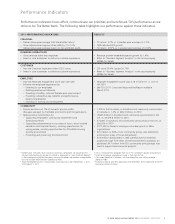
TD Canada Trust ranks “Highest in customer satisfaction among the Big Five Retail
Banks” – a study that looked at six major drivers of customer satisfaction. President’s
Choice Financial received the highest numerical score among the midsize retail
banks in the proprietary J.D. Power and Associates 2011 Canadian Retail Banking
Customer Satisfaction StudySM. Study based on 12,740 total responses measuring
eight banks. Proprietary study results are based on experiences and perceptions of
consumers surveyed November 1, 2010 to October 31, 2011. Visit jdpower.com.
TD has the most popular
mobile banking application
in Canada
with more than 1 million downloads
TD Bank, America’s
Most Convenient Bank,
®
reached earnings record
for the second year in a row,
U.S. Personal & Commercial
adjusted earnings surpassed
the $1 billion mark
TD named Best Bank
in North America
by Euromoney magazine for the
third year in a row
TD continued to grow
its ‘under-represented
businesses’
acquired Chrysler Financial and
MBNA Canada’s credit card portfolio
in fiscal 2011
Our retail operations
posted a record
$5.7 billion
in adjusted earnings for 2011
Canadian Wealth Advice
businesses hit milestone
$100 billion in assets
under administration despite
volatile markets
TD Securities maintained
its top-three dealer status
in Canada
#1 in equity underwriting and equity
block trading; #2 in syndicated loans,
corporate debt and M&A announced
TD Insurance’s total
premiums exceeded
$3 billion for the
second consecutive year
#2 personal home and auto
insurer in Canada
TD Canada Trust
named Highest in
Customer Satisfaction
among the Big Five Retail Banks
for the sixth year in a row2
Year at a Glance1