TD Bank 2011 Annual Report Download - page 3
Download and view the complete annual report
Please find page 3 of the 2011 TD Bank annual report below. You can navigate through the pages in the report by either clicking on the pages listed below, or by using the keyword search tool below to find specific information within the annual report.-
 1
1 -
 2
2 -
 3
3 -
 4
4 -
 5
5 -
 6
6 -
 7
7 -
 8
8 -
 9
9 -
 10
10 -
 11
11 -
 12
12 -
 13
13 -
 14
14 -
15
-
16
-
17
-
18
-
19
-
20
-
21
-
22
-
23
-
24
-
25
-
26
-
27
-
28
-
29
-
30
-
31
-
32
-
33
-
34
-
35
-
36
-
37
-
38
-
39
-
40
-
41
-
42
-
43
-
44
-
45
-
46
-
47
-
48
-
49
-
50
-
51
-
52
-
53
-
54
-
55
-
56
-
57
-
58
-
59
-
60
-
61
-
62
-
63
-
64
-
65
-
66
-
67
-
68
-
69
-
70
-
71
-
72
-
73
-
74
-
75
-
76
-
77
-
78
-
79
-
80
-
81
-
82
-
83
-
84
-
85
-
86
-
87
-
88
-
89
-
90
-
91
-
92
-
93
-
94
-
95
-
96
-
97
-
98
-
99
-
100
-
101
-
102
-
103
-
104
-
105
-
106
-
107
-
108
-
109
-
110
-
111
-
112
-
113
-
114
-
115
-
116
-
117
-
118
-
119
-
120
-
121
-
122
-
123
-
124
-
125
-
126
-
127
-
128
-
129
-
130
-
131
-
132
-
133
-
134
-
135
-
136
-
137
-
138
-
139
-
140
-
141
-
142
-
143
-
144
-
145
-
146
-
147
-
148
-
149
-
150
-
151
-
152
-
153
-
154
-
155
-
156
-
157
-
158
-
159
-
160
-
161
-
162
-
163
-
164
 |
 |

1TD BANK GROUP ANNUAL REPORT 2011 2011 SNAPSHOT
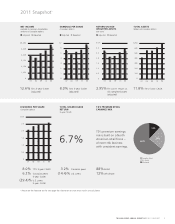
2011 Snapshot1
07 08 09 10 11
5
6
$7
4
3
2
1
0
EARNINGS PER SHARE
(Canadian dollars)
Adjusted Reported
07 08 09 10 11
0
$6,300
5,250
4,200
3,150
2,100
1,050
NET INCOME
available to common shareholders
(millions of Canadian dollars)
Adjusted Reported
07 08 09 10 11
0.5
1.5
2.0
2.5
$3.0
1.0
0
DIVIDENDS PER SHARE
(Canadian dollars)
TOTAL SHAREHOLDER
RETURN
(5-year CAGR)
TD’S PREMIUM RETAIL
EARNINGS MIX
07 08 09 10 11
3.5%
1.0
0.5
3.0
2.5
2.0
1.5
0
RETURN ON RISK-
WEIGHTED ASSETS
(per cent)
Adjusted Reported
07 08 09 10 11
100
400
500
$700
600
300
200
0
TOTAL ASSETS
(billions of Canadian dollars)
12.6% TD’s 5-year CAGR
(adjusted)
8.0% TD’s 5-year CAGR
6.2% Canadian peers
5-year CAGR
(29.4)% U.S. peers
5-year CAGR
3.2% Canadian peers
(14.4)% U.S. peers
88% Retail
12% Wholesale
8.0% TD’s 5-year CAGR
(adjusted)
2.95% TD’s 2011 return on
risk-weighted assets
(adjusted)
11.8% TD’s 5-year CAGR
6.7%
TD’s premium earnings
mix is built on a North
American retail focus –
a lower-risk business
with consistent earnings.
64%
24%
12%
Canadian Retail
U.S. Retail
Wholesale
1
Please see the footnote on the next page for information on how these results are calculated.