Sunoco 2015 Annual Report Download - page 10
Download and view the complete annual report
Please find page 10 of the 2015 Sunoco annual report below. You can navigate through the pages in the report by either clicking on the pages listed below, or by using the keyword search tool below to find specific information within the annual report.
8
Natural Gas Liquids
Our Natural Gas Liquids segment transports, stores, and executes acquisition and marketing activities utilizing an
integrated network of pipeline assets, storage and blending facilities, and strategic off-take locations that provide access to
multiple NGL markets.
Since December 31, 2010, we completed the following acquisitions in our Natural Gas Liquids segment:
• In April 2013, we acquired Sunoco's Marcus Hook Industrial Complex and related assets. The acquisition included
terminalling and storage assets with a capacity of approximately 2 million barrels of NGLs storage capacity in
underground caverns.
NGLs Pipelines
This segment includes approximately 900 miles of NGLs pipelines, primarily related to our Mariner systems in the
northeast and southwest United States.
The table below summarizes the average daily number of barrels of NGLs transported on our pipelines in each of the
years presented:
Year Ended December 31,
2015 2014 2013
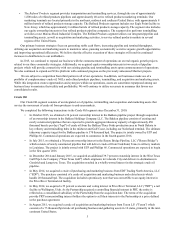
NGLs pipelines throughput (thousands of bpd) 209 33 9
Our Mariner East project transports NGLs from the Marcellus and Utica Shale areas in Western Pennsylvania, West
Virginia and Eastern Ohio to destinations in Pennsylvania, including our Marcus Hook Industrial Complex on the Delaware
River, where they are processed, stored and distributed to local, domestic and waterborne markets. The first phase of the
project, referred to as Mariner East 1, consisted of interstate and intrastate propane and ethane service and commenced
operations in the fourth quarter of 2014 and the first quarter of 2016, respectively. The second phase of the project, referred to
as Mariner East 2, will expand the total takeaway capacity to 345 thousand barrels per day for interstate and intrastate propane,
ethane and butane service, and is expected to commence operations in the first half of 2017.
In the fourth quarter 2014, we commenced operations on the Mariner South pipeline. The Mariner South pipeline is part
of a joint project with Lone Star NGL LLC ("Lone Star") to deliver export-grade propane and butane products from Lone Star’s
Mont Belvieu, Texas storage and fractionation complex to our marine terminal in Nederland, Texas. The pipeline has a capacity
of approximately 200 thousand barrels per day and can be scaled depending on shipper interest.
The Mariner West pipeline provides transportation of ethane products from the Marcellus Shale processing and
fractionating areas in Houston, Pennsylvania to Marysville, Michigan and the Canadian border. Mariner West commenced
operations in the fourth quarter 2013, with capacity to transport approximately 50 thousand barrels per day of NGLs and other
products.
Revenues on our NGLs pipelines are generated from tariffs paid by shippers utilizing our transportation services. These
tariffs are filed with FERC and other state and Canadian regulatory agencies, as applicable.
NGLs Terminals
Our NGLs terminals generate revenue primarily by charging fees based on throughput, blending services and storage.
The table below summarizes the total average daily throughput for our NGLs terminals in each of the years presented:
Year Ended December 31,
2015 2014 2013
NGLs terminals throughput (thousands of bpd) 184 40 31
Nederland
In addition to crude oil activities, the Nederland terminal also provides approximately 1 million barrels of storage and
distribution services for NGLs in connection with the Mariner South pipeline project referred to above, which commenced
operations in December 2014. The project provides transportation of propane and butane products from the Mont Belvieu
region to the Nederland terminal, where such products can be delivered via ship.

