Sunbeam 2010 Annual Report Download - page 8
Download and view the complete annual report
Please find page 8 of the 2010 Sunbeam annual report below. You can navigate through the pages in the report by either clicking on the pages listed below, or by using the keyword search tool below to find specific information within the annual report.-
 1
1 -
 2
2 -
 3
3 -
 4
4 -
 5
5 -
 6
6 -
 7
7 -
 8
8 -
 9
9 -
 10
10 -
 11
11 -
 12
12 -
 13
13 -
 14
14 -
 15
15 -
 16
16 -
 17
17 -
 18
18 -
 19
19 -
20
-
21
-
22
-
23
-
24
-
25
-
26
-
27
-
28
-
29
-
30
-
31
-
32
-
33
-
34
-
35
-
36
-
37
-
38
-
39
-
40
-
41
-
42
-
43
-
44
-
45
-
46
-
47
-
48
-
49
-
50
-
51
-
52
-
53
-
54
-
55
-
56
-
57
-
58
-
59
-
60
-
61
-
62
-
63
-
64
-
65
-
66
-
67
-
68
-
69
-
70
-
71
-
72
 |
 |

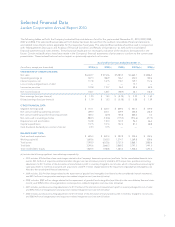
Selected Financial Data
Jarden Corporation Annual Report 2010
(b) The results of Pure Fishing, Inc., K2 Inc., Mapa Spontex, Aero and Quickie are included from their dates of acquisition April 6, 2007, August 8,
2007, April 1, 2010, October 1, 2010 and December 17, 2010, respectively.
(c) Reorganization and acquisition-related integration cost include costs associated with exit or disposal activities, including costs of employee and
lease terminations and facility closing or other exit activities. Additionally, these costs include expenses directly related to integrating and reorga-
nizing acquired businesses and include items such as employee retention, recruiting costs, certain moving costs, certain duplicative costs during
integration and asset impairments.
(d) Segment Earnings represents earnings before interest, taxes and depreciation and amortization, excluding certain reorganization and acquisition-
related costs, impairment of goodwill and intangible assets, transaction costs, other items, non-cash Venezuela hyperinflationary and devaluation
charges, mark-to-market net impact on non-hedged Euro denominated debt, fair value inventory adjustments, and loss on early extinguishment
of debt. This non-GAAP financial measure is presented in this Annual Report because it is a basis upon which the Company’s management has
assessed its financial performance in the years presented. Additionally, the Company uses non-GAAP financial measures because the Company’s
credit agreement provides for certain adjustments in calculations used for determining whether the Company is in compliance with certain credit
agreement covenants, including, but not limited to, adjustments relating to non-cash purchase accounting adjustments, certain reorganization and
acquisition-related integration costs, impairment of goodwill and intangible assets, non-cash stock-based compensation costs and loss on early
extinguishment of debt. Segment Earnings should not be considered a primary measure of the Company’s performance and should be reviewed
in conjunction with, and not as substitute for, financial measurements prepared in accordance with generally accepted accounting principles
in the United States of America (“GAAP”) that are presented in this Annual Report. A reconciliation of the calculation of Segment Earnings
is presented below:.
Reconciliation of non-GAAP Measure:
(1) For 2009, Segment Earnings includes reorganization costs of $3.8 million related to the Consumer Solutions segment.
(2) During 2008, the Company modified the composition of Segment Earnings to include stock-based compensation. All prior periods have been
restated to conform to the current presentation.
(3) Amount in 2009 represents executive stock compensation resulting from a strategic review of executive long-term incentive compensation.
(e) In September 2009, the Company announced that the Board had decided to initiate a quarterly cash dividend starting in the third quarter of 2009.
(f) Working capital is defined as current assets (including cash) less current liabilities. For 2010, 2009, 2008, 2007 and 2006, working capital excluding
cash was $998 million, $676 million, $982 million, $1.0 billion and $637 million, respectively.
For the Years Ended December 31,
(In millions) 2010 2009 2008 2007 2006
Net income (loss) $ 106.7 $ 128.7 $ (58.9) $ 28.1 $ 106.0
Income tax provision 122.8 110.7 26.3 38.5 82.0
Interest expense, net 177.8 147.5 178.7 149.7 112.6
Loss on early extinguishment of debt — — — 15.7 —
Operating earnings 407.3 386.9 146.1 232.0 300.6
Adjustments to reconcile to Segment Earnings:
Depreciation and amortization 142.8 130.3 120.3 96.4 66.4
Fair value adjustment to inventory 27.4 — — 118.9 10.4
Venezuela hyperinflationary and devaluation charges 70.6 — — — —
Reorganization costs, acquisition-related and other charges 42.3 48.5 59.8 54.2 41.3
Impairment of goodwill and intangibles 19.7 22.9 283.2 — —
Other adjustments (3) — 17.1 — — 0.3
Segment Earnings (1)(2) $ 710.1 $ 605.7 $ 609.4 $ 501.5 $ 419.0
6