Sunbeam 2010 Annual Report Download - page 7
Download and view the complete annual report
Please find page 7 of the 2010 Sunbeam annual report below. You can navigate through the pages in the report by either clicking on the pages listed below, or by using the keyword search tool below to find specific information within the annual report.-
 1
1 -
 2
2 -
 3
3 -
 4
4 -
 5
5 -
 6
6 -
 7
7 -
 8
8 -
 9
9 -
 10
10 -
 11
11 -
 12
12 -
 13
13 -
 14
14 -
 15
15 -
 16
16 -
 17
17 -
 18
18 -
19
-
20
-
21
-
22
-
23
-
24
-
25
-
26
-
27
-
28
-
29
-
30
-
31
-
32
-
33
-
34
-
35
-
36
-
37
-
38
-
39
-
40
-
41
-
42
-
43
-
44
-
45
-
46
-
47
-
48
-
49
-
50
-
51
-
52
-
53
-
54
-
55
-
56
-
57
-
58
-
59
-
60
-
61
-
62
-
63
-
64
-
65
-
66
-
67
-
68
-
69
-
70
-
71
-
72
 |
 |

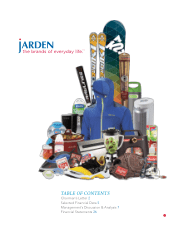
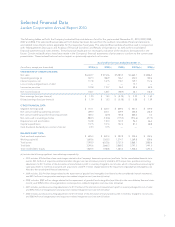
Selected Financial Data
Jarden Corporation Annual Report 2010
The following tables set forth the Company’s selected financial data as of and for the years ended December 31, 2010, 2009, 2008,
2007 and 2006. The selected financial data set forth below has been derived from the audited consolidated financial statements
and related notes thereto where applicable for the respective fiscal years. The selected financial data should be read in conjunction
with “Management’s Discussion and Analysis of Financial Condition and Results of Operations,” as well as the consolidated
financial statements and notes thereto. These historical results are not necessarily indicative of the results to be expected in the
future. Certain reclassifications have been made in the Company’s financial statements of prior years to conform to the current year
presentation. These reclassifications had no impact on previously reported net income.
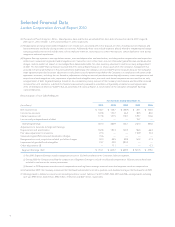
(a) Includes the following significant items affecting comparability:
• 2010 includes: $70.6 million of non-cash charges related to the Company’s Venezuela operations (see Note 1 to the consolidated financial state-
ments); $42.3 million of acquisition-related and other charges (see item (c) below), primarily related to 2010 acquisitions; purchase accounting
adjustments for $27.4 million of the elimination of manufacturer’s profit in inventory charged to cost of sales, which is the purchase accounting fair
value adjustment to inventory associated with acquisitions; and $19.7 million charge related to the impairment of goodwill and intangibles (see
Note 6 to the consolidated financial statements).
• 2009 includes: $22.9 million charge related to the impairment of goodwill and intangibles (see Note 6 to the consolidated financial statements);
and $52.3 million of reorganization and acquisition-related integration cost (see item (c) below).
• 2008 includes: $283 million charge related to the impairment of goodwill and intangibles (see Note 6 to the consolidated financial state-
ments); and $59.8 million of reorganization and acquisition-related integration cost (see item (c) below).
• 2007 includes: purchase accounting adjustments for $119 million of the elimination of manufacturer’s profit in inventory charged to cost of sales;
and $49.6 million of reorganization and acquisition-related integration cost (see item (c) below).
• 2006 includes: purchase accounting adjustments for $10.4 million of the elimination of manufacturer’s profit in inventory charged to cost of sales;
and $36.8 million of reorganization and acquisition-related integration cost (see item (c) below).
As of and for the Years Ended December 31,
(In millions, except per share data) 2010(b)(c) 2009(c) 2008(c) 2007(b)(c) 2006(c)
STATEMENTS OF OPERATIONS DATA
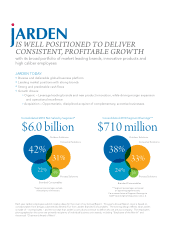
Net sales $ 6,022.7 $ 5,152.6 $ 5,383.3 $ 4,660.1 $ 3,846.3
Operating earnings (a) 407.3 386.9 146.1 232.0 300.6
Interest expense, net 177.8 147.5 178.7 149.7 112.6
Loss on early extinguishment of debt — — — 15.7 —
Income tax provision 122.8 110.7 26.3 38.5 82.0
Net income (loss) (a) 106.7 128.7 (58.9) 28.1 106.0
Basic earnings (loss) per share (a) $ 1.20 $ 1.53 $ (0.78) $ 0.39 $ 1.62
Diluted earnings (loss) per share (a) $ 1.19 $ 1.52 $ (0.78) $ 0.38 $ 1.59
OTHER FINANCIAL DATA
Segment earnings (a)(d) $ 710.1 $ 605.7 $ 609.4 $ 501.5 $ 419.0
Net cash provided by operating activities 289.0 641.1 249.9 304.8 236.0
Net cash provided by (used in) financing activities 480.2 (32.5) 104.6 680.6 4.4
Net cash used in investing activities (883.1) (130.6) (175.5) (972.6 ) (277.5)
Depreciation and amortization 142.8 130.3 120.3 96.4 66.4
Capital expenditures 137.5 107.4 102.2 81.2 68.8
Cash dividends declared per common share (e) 0.33 0.15 — — —
BALANCE SHEET DATA
Cash and cash equivalents $ 695.4 $ 827.4 $ 392.8 $ 220.5 $ 202.6
Working capital (f) 1,693.6 1,503.5 1,374.7 1,269.8 839.6
Total assets 7,093.0 6,023.6 5,727.0 5,868.1 3,882.6
Total debt 3,240.6 2,666.2 2,868.3 2,747.3 1,441.0
Total stockholders’ equity 1,820.5 1,766.8 1,384.2 1,538.6 1,257.4
5