Sunbeam 2010 Annual Report Download - page 14
Download and view the complete annual report
Please find page 14 of the 2010 Sunbeam annual report below. You can navigate through the pages in the report by either clicking on the pages listed below, or by using the keyword search tool below to find specific information within the annual report.-
 1
1 -
2
-
3
-
 4
4 -
 5
5 -
 6
6 -
 7
7 -
 8
8 -
 9
9 -
 10
10 -
 11
11 -
 12
12 -
 13
13 -
 14
14 -
 15
15 -
 16
16 -
 17
17 -
 18
18 -
 19
19 -
 20
20 -
 21
21 -
 22
22 -
 23
23 -
 24
24 -
25
-
26
-
27
-
28
-
29
-
30
-
31
-
32
-
33
-
34
-
35
-
36
-
37
-
38
-
39
-
40
-
41
-
42
-
43
-
44
-
45
-
46
-
47
-
48
-
49
-
50
-
51
-
52
-
53
-
54
-
55
-
56
-
57
-
58
-
59
-
60
-
61
-
62
-
63
-
64
-
65
-
66
-
67
-
68
-
69
-
70
-
71
-
72
 |
 |

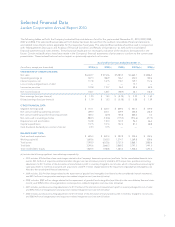
Management’s Discussion and Analysis
Jarden Corporation Annual Report 2010
Net sales for 2009 decreased $231 million, or 4.3%, to $5.2 billion versus the same prior year period. The overall decrease in net
sales was primarily due to unfavorable foreign currency translation (approximately $89.7 million), a 24.7% ($86.0 million) decline in
sales in the Process Solutions segment, due primarily to a decline in the pass-through pricing of commodities and lower coinage
and OEM sales, which is typical in a recessionary environment and declines in domestic and international sales resulting from overall
macroeconomic weakness. Net sales in the Outdoor Solutions segment decreased $169 million or 6.8%, primarily as the result of
unfavorable foreign currency translation (approximately $48 million) and declines in domestic and international sales resulting from
overall economic weakness. Net sales in the Consumer Solutions segment increased $23.0 million or 1.3%, which was primarily due
to increased demand in the small appliance and certain personal care and wellness categories, which was primarily due to gains
in category space at certain major retailers, certain marketing efforts and new product introduction, partially offset by unfavorable
foreign currency translation (approximately $29 million) and decreased demand internationally, primarily in Latin America, resulting
from overall economic weakness. Net sales in the Branded Consumables segment decreased $12.8 million or 1.6%, which was
mainly due to unfavorable foreign currency translation (approximately $9 million), continued weakness at retail, primarily at domestic
home improvement retailers resulting from overall economic weakness, partially offset by improved sales of Ball® and Kerr® fresh
preserving products, which has been driven in part, by the consumer trend of looking to save money, combined with the Company’s
marketing efforts celebrating the 125th anniversary of the Ball® jar.
Cost of sales for 2009 decreased $154 million to $3.7 billion versus the same prior year period. Cost of sales as a percentage of net
sales for 2009 and 2008 was 72.3% and 72.1%, respectively. The impact due to the sell through, primarily during the first quarter
of 2009, of higher cost inventory which was built in 2008 during the unprecedented rise in commodity prices was offset by lower
commodity prices in 2009, maintaining inventory at levels consistent with our working capital goals and the realization of cost
reductions from prior integration and ongoing continuous improvement programs.
SG&A for 2009 decreased $49.8 million, or 4.9%, to $964 million versus the same prior year period. The improvement was primarily
due to cost containment efforts initiated by the Company in 2009 as a result of the macroeconomic conditions, partially offset by an
incremental increase stock-based compensation for 2009 ($20.7 million) versus 2008. SG&A as a percentage of net sales for 2009 and
2008 was 18.7% and 18.8%, respectively.
Operating earnings for 2009 in the Outdoor Solutions segment decreased $10.7 million or 6.2%, versus the same prior year period
primarily as the result of the gross margin impact of lower sales and a $15.9 million increase in reorganization costs, partially offset
by a decrease in SG&A ($53.5 million) and a decrease in impairment charges for goodwill and intangible assets ($29.4 million).
Operating earnings for 2009 in the Consumer Solutions segment increased $110 million or 73.0%, versus the same prior year period
primarily as the result of a decrease in impairment charges for goodwill and intangible assets ($76.3 million), lower SG&A ($22.4
million) and improved gross margins, partially offset by increased reorganization costs ($3.7 million). Operating earnings for 2009
in the Branded Consumables segment increased $168 million or 155.5%, versus the same prior year period primarily as the result
of a decrease in impairment charges for goodwill and intangible assets ($155 million) and a decrease in reorganization costs ($10.7
million). Operating earnings in the Process Solutions segment for 2009 decreased $2.5 million or 11.8%, versus the same prior year
period primarily as the result of the gross margin impact of lower sales, partially offset by a decrease of SG&A ($2.9 million) and
reorganization costs ($8.9 million).
Reorganization costs for 2009 decreased by $7.5 million to $52.3 million versus the same prior year period. The majority of these
charges ($48.5 million) relate to plans to rationalize the overall cost structure of the Outdoor Solutions segment. These plans consist
of restructuring the Company’s domestic and European paintball operations, realigning distribution and warehouse facilities both
domestically and in Europe, rationalizing manufacturing operations in the Far East and integrating various 2009 tuck-in acquisitions.
The Company also recorded reorganization costs ($3.8 million) during 2009 within the Consumer Solutions segment for headcount
reductions related to cost reduction initiatives.
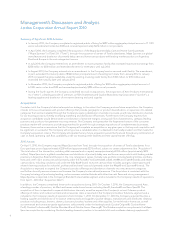
Results of Operations—Comparing 2009 to 2008
Net Sales
Operating Earnings
(Loss)
Years Ended December 31,
(In millions) 2009 2008 2009 2008
Outdoor Solutions $ 2,311.8 $ 2,481.0 $ 161.6 $ 172.3
Consumer Solutions 1,835.9 1,812.9 260.4 150.5
Branded Consumables 792.1 804.9 60.0 (108.0)
Process Solutions 262.6 348.6 18.7 21.2
Corporate — — (113.8) (89.9)
Intercompany eliminations (49.8) (64.1) — —
$ 5,152.6 $ 5,383.3 $ 386.9 $ 146.1
12